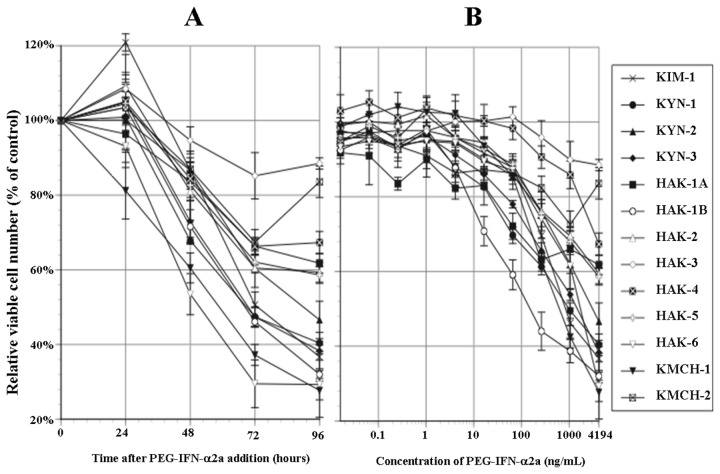
Figure 1. Anti-proliferative effect of PEG-IFN-α2a.
(A) Chronological changes in relative viable cell number (% of the control) after adding 4,194 ng/mL of PEG-IFN-α2a. Growth was suppressed with time in 8 cell lines. (B) 96 hours after adding 10 different concentrations of PEG-IFN-α2a. Cell proliferation was suppressed in a dose-dependent manner in 11 cell lines. The suppression was significant (P < 0.0001~0.05) in the ranges of 0.016~4,194 ng/mL of PEG-IFN-α2a in HAK-6, 0.256~4,194 ng/mL in KYN-3 and HAK-1A, 4.096~4,194 ng/mL in KIM-1, KYN-1, HAK-1B, HAK-2 and KMCH-2, 16.4~4,194 ng/mL in KYN-2, HAK-5 and KMCH-1, 262~4,194 ng/mL in HAK-4, and at 4,194 ng/mL in HAK-3 (Student t-test). Eight samples were used in each experiment (n = 8). The experiment was repeated at least 3 times for each cell line. The figures represent average ± SE of the experiments.

