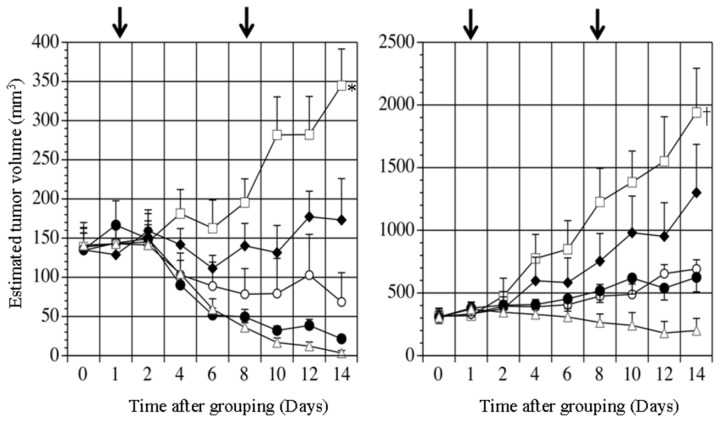
Figure 3. Time-course change in estimated tumor volumes of subcutaneously transplanted HAK-1B (A) or KIM-1 (B) tumors in nude mice in Experiment 1.
The mice received a subcutaneous injection of 0.06 (▲), 0.6 (○), 6 (●), or 60 (∆) µg of PEG-IFN-α2a, or medium alone (Control) (□), once a week for 2 consecutive weeks. The arrows show the days of injection. The figures represent average ± SE. *P < 0.0001, versus the other groups. †P < 0.01, versus the other groups.

