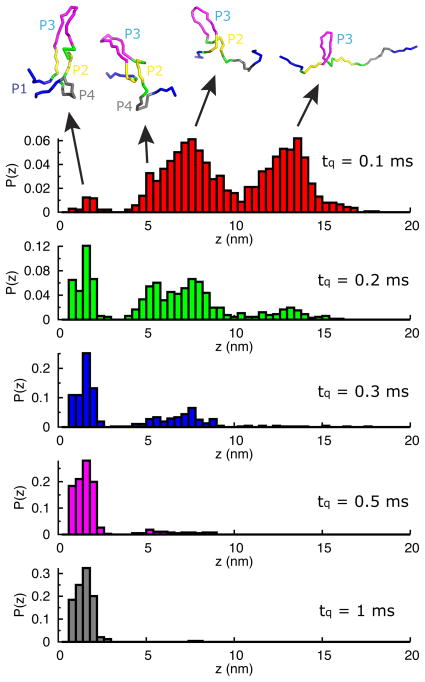
Figure 10.
The distribution of the extension, z, of the SAM-III riboswitch at the end of a quenching period (t =tq) during the stretch-quench cycles, with fs = 20 pN and fq = 8 pN. When tq = 0.1 ms, which is much smaller than the folding time, τF, there are several peaks in P(z), which correspond to the states that are sampled. The position of the peaks corresponds to the most probable extensions of the intermediate states. As tq increases, the distribution converges to around z(tq) ~ 2 nm, corresponding to the fully folded state. By varying tq elusive states can be captured. For example, with τq = 0.1ms a state with P2, P3, and P4 intact but P1 disordered is visible (z ~ 5 nm) in the histogram in red.

