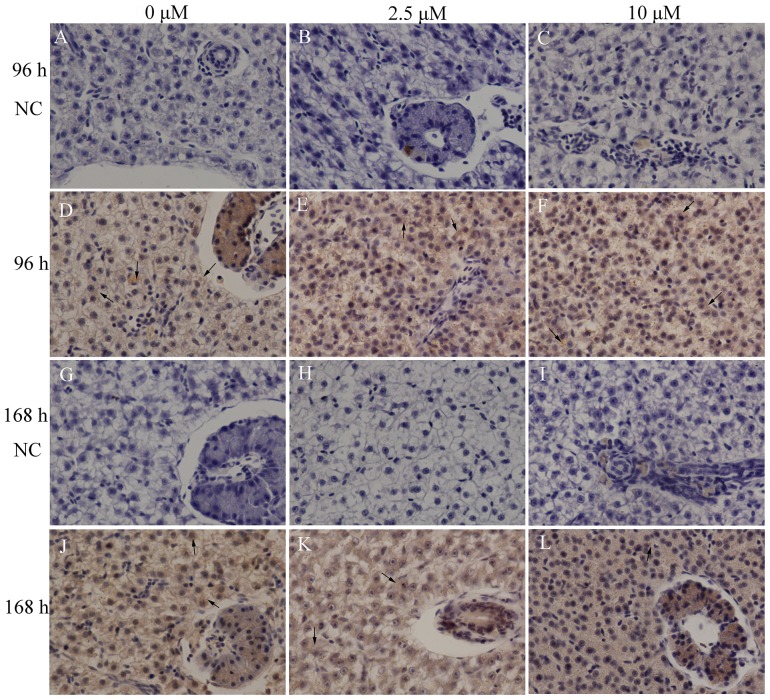
Figure 7. Immunolocalization of caspase-3A in liver sections.
NC represents negative control (substitution normal non-immune serum from the same host animal as the primary antibody). All the negative controls show no positive staining [Fig. 7(A-C), 7(G-I)]. Both control groups [Fig 7(D and J)] and experimental groups [Fig 7(E, F, K and L)] reveal weak immunolabeling. Arrows indicate the cytoplasm of hepatocytes. The representative photographs are shown at 200 × magnification.

