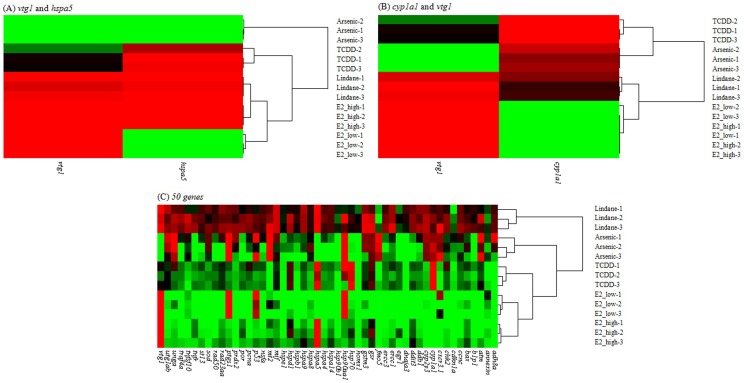
Figure 4. Clustering relationships among chemicals/concentrations using mRNA expression data of (A) cyp1a1 and vtg1, (B) vtg1 and hspa5 and (C) 50 genes with the marximum RD.
TCDD: 5 nM 2,3,7,8-tetrachlorodibenzo-p-dioxin; lindane: 100 µg/L lindane; arsenic: 15 mg/L arsenic; E2_low: 5 µg/L 17β-estradiol; E2_high: 50 µg/L 17β-estradiol. The full names of genes can be found in Table S1 or S2.

