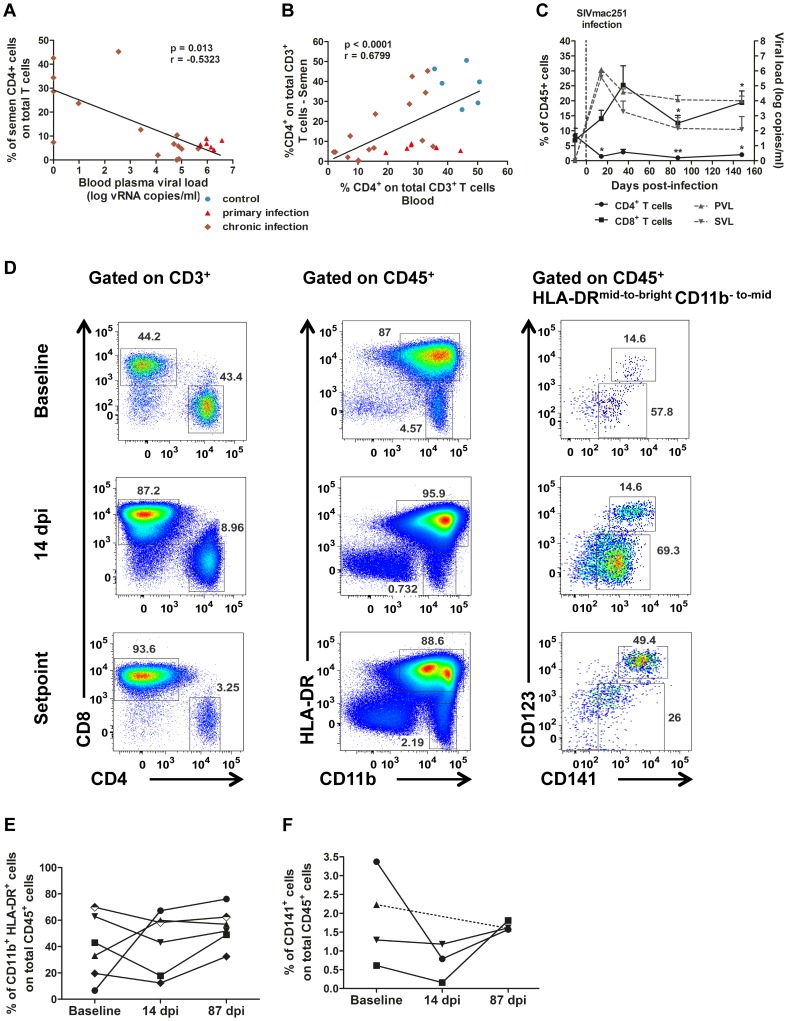
Figure 3. Changes in semen T cells, macrophages and DCs during SIV infection.
(A) Spearman's correlation between the proportion of CD4+ T cells among total T cells in the semen and PVL (n = 6 macaques at 14 dpi – red triangle, n = 15 at chronic stage – brown diamond). (B) Spearman's correlation between the proportions of CD4+ T cells among total T cells for semen and blood (n = 6 macaques at 14 dpi – red triangle, n = 15 at chronic stage – brown diamond, and n = 6 SIV− macaques). (C) RNA viral loads in blood (dotted line, grey triangle base down) and semen (dotted line, grey triangle base up) and changes in CD4+ (solid line, black circle) and CD8+ T-cell proportions (solid line, black box) during SIV infection; mean and SEM are represented. (D) Longitudinal follow-up of CD4+ and CD8+ T cells, CD11b+ HLA-DRbright macrophages, CD11bbright HLA-DR− polymorphonuclear cells and CD141+ dendritic cells, including CD123+ pDCs. Dot plots from a representative animal infected with 5,000 AID50 IV. (E) Longitudinal follow-up of CD11b+ HLA-DRbright macrophages in 6 macaques infected with 5,000 AID50 IV; each line represents an animal. (F) Longitudinal follow-up of CD123+ CD141+ pDCs in 4 SIV+ macaques.

