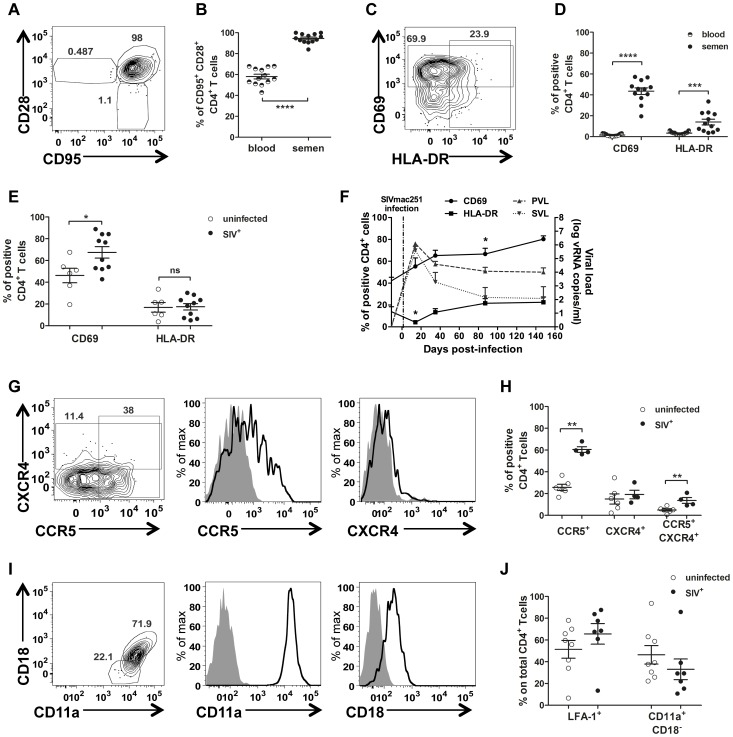
Figure 5. Semen CD4+ T-cell phenotype.
(A) Gating of central memory CD4+ T cells (CD95+CD28+) (B) Comparison of CD4+ T-cell differentiation markers between blood (half plain dot) and semen (plain dot) (n = 13 uninfected macaques). (C) Gating strategy for CD69 and HLA-DR expression. (D) CD69 and HLA-DR expression in CD4+ T cells in blood (half plain dots) and semen (plain dots) from SIV− macaques (n = 13). (E) CD69 and HLA-DR expression in semen CD4+ T cells from SIV− (n = 6, empty dots) and SIV+ macaques, at different stages of infection (n = 10, plain dots). (F) Longitudinal follow-up of CD69 (solid line, plain dot) and HLA-DR (solid line, plain box) expression in semen CD4+ T cells during infection (n = 6). Dotted lines represent PVL (plain grey triangle base down) and SVL (plain grey triangle base up) (G). CCR5 and CXCR4 expression in CD4+ T cells from a representative uninfected macaque. From left to right: contour plots representing outliers, overlay of CCR5 and CXCR4 staining (black line) and isotype control (solid gray curve). (H) Comparison of CCR5+, CXCR4+ and CCR5+ CXCR4+ CD4+ T cells between SIV− (n = 6, open dot) and chronically SIV-infected macaques (n = 6, plain dot). (I) Gating strategy for LFA-1 integrin expression on CD4+ T cells. From left to right: contour plots representing the outliers, overlay of CD11a and CD18 staining (black line) and isotype control (solid gray curve) (J) Comparison of CD11a+ CD18+ (LFA-1) CD4+ T cells between SIV− (n = 6, open dot) and chronically SIV-infected macaques (n = 7, plain dot). Mean and SEM are represented.

