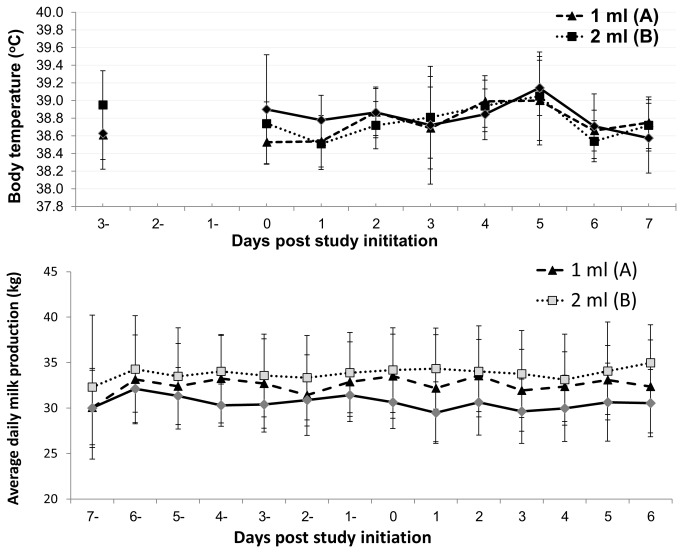
Figure 2. Daily measured rectal temperature (°C) and milk production (kg) pre vaccination and post vaccination.
(I) Mean body temperature and (II) daily average milk production before and after vaccination with inactivated bovine ephemeral fever vaccine. Day 0: study initiation and first vaccination. Triangles: 1-ml vaccine. Squares: 2 -ml vaccine. Rhombuses: control group. Whiskers represent standard deviation for each group.

