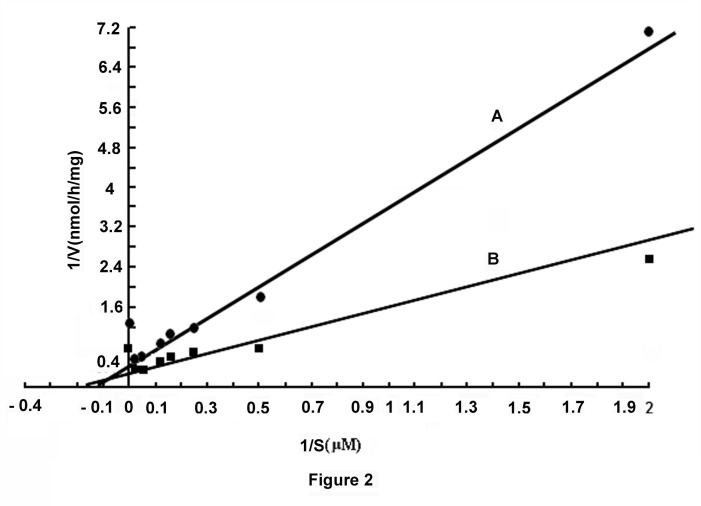
Figure 2. Line-Weaver Burk plot of the stimulation of glucose induced NO synthesis in mice liver preparation.
The mice liver membrane in HEPES buffer, pH 7.4, was incubated in the presence and absence of 0.02M glucose with different amounts of l- arginine and 2.0mM CaCl2 in a total volume of 1.0ml. After incubation for 30 min at 37°C the synthesis of NO was determined by methemoglobin method as described in the Materials and Methods.
Line A represents the synthesis of NO in the absence of added glucose to the reaction mixture with different concentrations of l-arginine. Line B represents the synthesis of NO in the reaction mixture in the presence of 0.02M glucose and with different amounts of l-arginine.

