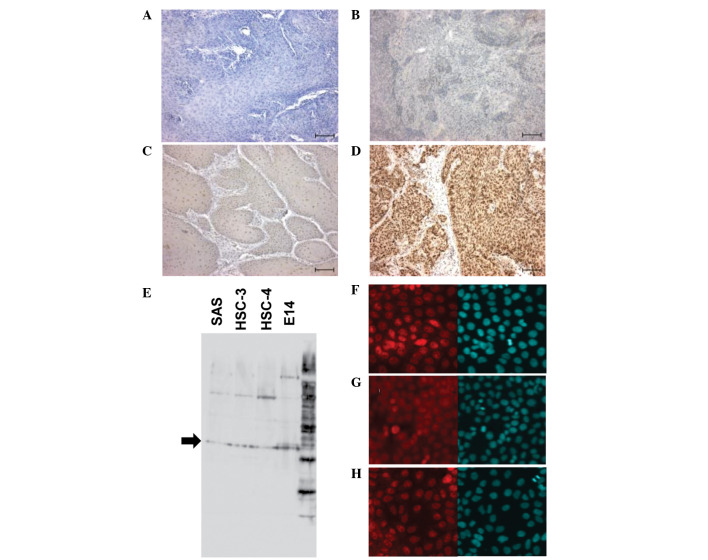
Figure 1.
Expression of NANOG protein in OSCC tissues and cell lines. (A) Negative expression of NANOG in OSCC tissues (−). (B) Weak expression of NANOG in OSCC tissues (+). (C) Moderate expression of NANOG in OSCC tissues (++). (D) Strong expression of NANOG in OSCC tissues (+++) (scale bars, 100 μm). (E) Western blot analysis of NANOG protein expression in SAS, HSC-3 and HSC-4 cells. Nanog protein in mouse embryonic stem cells (E14) was used as a positive control for western blotting (arrow indicates 35 kDa). Immunocytochemical analysis of NANOG protein expression in (F) SAS, (G) HSC-3 and (H) HSC-4 cells. Right panels show 4′,6-diamidino-2-phenylindole staining in the nuclei of the cells. OSCC, oral squamous cell carcinoma.

