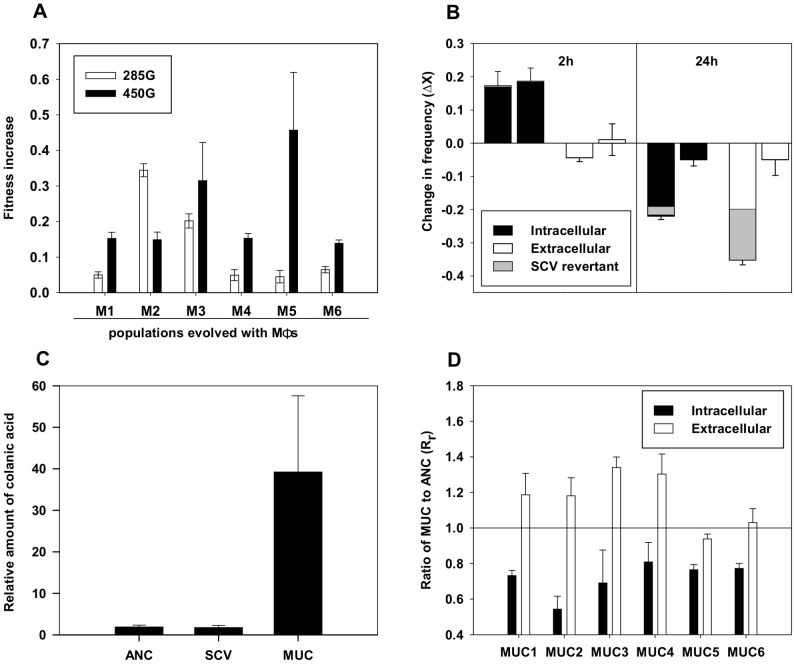
Figure 2. Phenotypic characterization of evolved populations.
(A) Fitness increase of M1 to M6 populations relative to the ancestral clone at 285 (white bars) generations and 450 (black bars) generations. Error bars correspond to 2SE. (B) Competitive fitness of SCV clones in presence of MΦ. The change in frequency (ΔX) of the evolved bacteria against the ancestral in the intracellular (black bars) and extracellular (white bars) niche of the MΦ at MOI (1∶1). Clones are ranked in the following order: SCV_M1_D8 and SCV_M3_D5. Because SCV clones revert to ancestral looking colonies, frequencies of those phenotypic revertant SCV_REV colonies are shown in grey. (C) MUC clones overproduce colanic acid. After purification from the growth medium of each clone (SCV_M1_D8, MUC_M3_D19 and ANC), the amount of colanic acid was determined by measuring non-dialyzable methylpentose (fucose) absorbance at 396 and 427 nm after reaction with sulfuric acid and cysteine hydrochloride. Measurements were repeated three times for each clone. Obtained values (ΔA396–ΔA427) were directly correlated with fucose calibration curve (see Fig. S2) and normalized for CFUs. (D) Evidence that MUC clones adapted to better escape MΦ phagocytosis. Rr represents the relative abundance (Rr) of evolved clones to that of the ancestral at 3 h of infection. Clones MUC1 to MUC6 were sampled from each independent evolution. In black bars the relative abundance inside MΦ and in white bars outside MΦ. All evolved clones show a smaller abundance inside MΦ, suggesting that these are better adapted to escape MΦ phagocytosis. Error bars correspond to 2SE.

