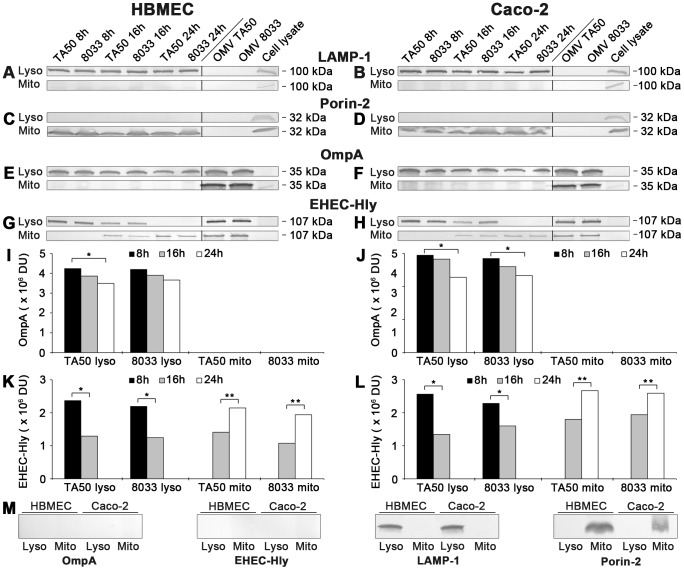
Figure 8. Detection of OMVs and EHEC-Hly in lysosomal and mitochondrial fractions of cells treated with EHEC-Hly-containing OMVs.
(A-H) Lysosomes (Lyso) and mitochondria (Mito) were isolated from HBMEC and Caco-2 cells, which had been incubated with OMVs TA50 or 8033 for 8 h, 16 h and 24 h as described in Materials and Methods. The lysosomal and mitochondrial fractions were analyzed using Western blot for marker proteins of each respective fraction including LAMP-1 (A, B) and porin-2 (C, D), and for OMVs (anti-OmpA antibody) (E, F) and EHEC-Hly (G, H). Signals elicited from the lysosomal and mitochondrial fractions at each time are shown in the first part of each immunoblot, whereas the second part (separated by a line) includes controls run at the same gel (isolated OMVs TA50 and 8033 and cell lysates). The sizes of immunoreactive bands are indicated along the right sides of the blots. (I–L) Densitometric quantification of OmpA (I, J) and EHEC-Hly (K, L) signals shown in E, F and G, H, respectively, using Quantity One software; * significantly decreased (p<0.05) compared to 8 h; ** significantly increased (p<0.05) compared to 16 h (unpaired Student's t test). (M) Immunoblots of isolated lysosomal and mitochondrial fractions from control, OMV non-treated HBMEC and Caco-2 cells with the antibodies indicated.

