
Figure 2.
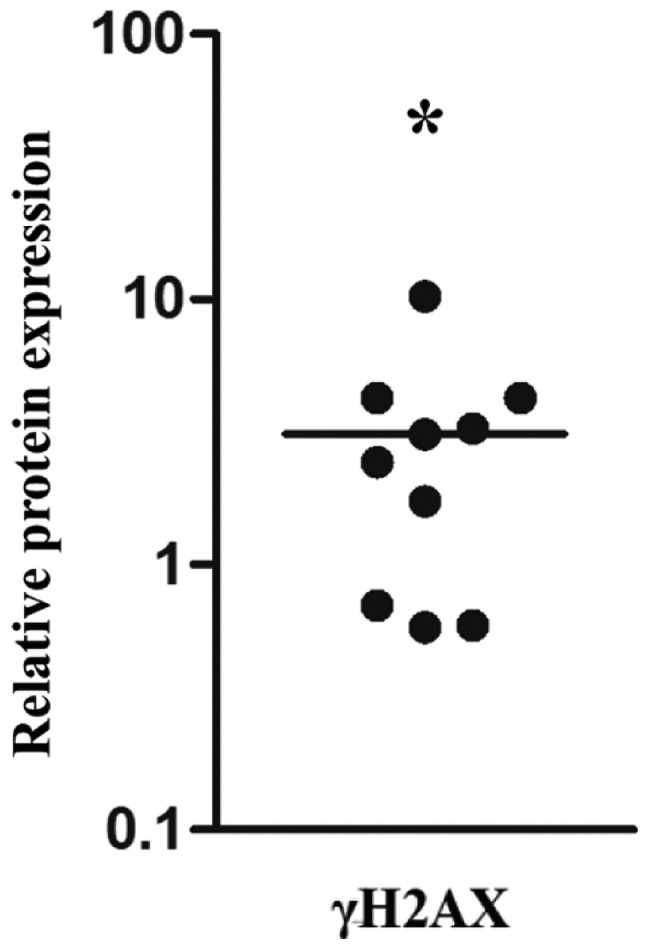
Relative γH2AX protein expression levels in gastric carcinoma compared with adjacent non-tumorous mucosa. Immunoblots of γH2AX were scanned and the relative protein expression level of tumor samples were compared with their adjacent non-cancerous counterparts and expressed as a percentage of β-actin. *P<0.001. γH2AX, phosphorylated H2AX at Ser 139.