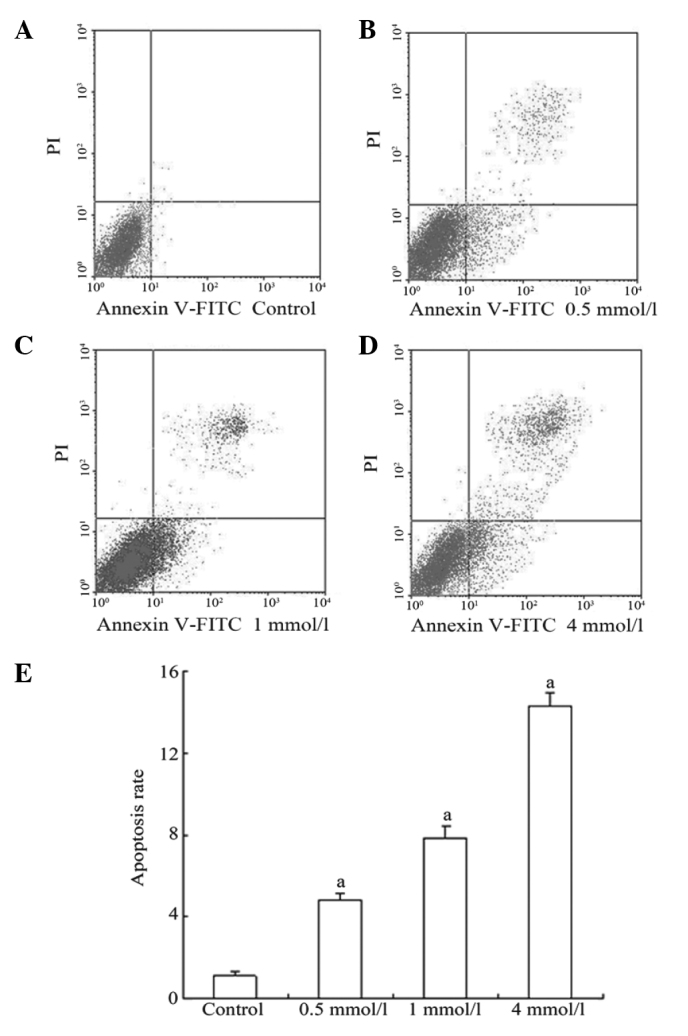
Figure 1.

Rate of apoptosis following VPA treatment. Cells were exposed to (A) PBS as a control, or VPA at (B) 0.5 mmol/l, (C) 1 mmol/l or (D) 4 mmol/l. The cells were then collected after 48 h, and apoptosis was assessed by Annexin-V-fluorescein isothiocyanate (FITC) staining and flow cytometric analysis. (E) There was an observed increase in the apoptosis rate in the test groups. Data represent the average of three experiments. Error bars represent one standard deviation. aP<0.05, compared with untreated controls. VPA, valproic acid; PBS, phosphate-buffered saline.
