
Figure 4.
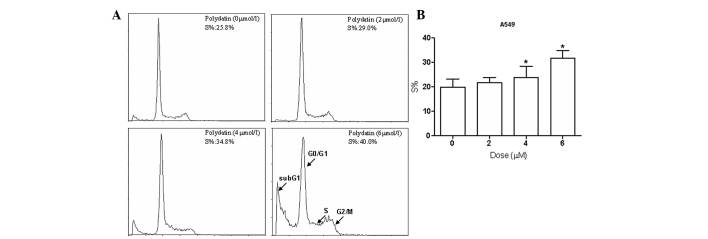
Cell cycle arrest induced by PD in A549 human lung cancer cells. Cells were treated with increasing concentrations of PD. Following 48 h of treatment, cells were labeled with propidium iodide and then analyzed by DNA flow cytometry. (A) Results indicate the percentage of cells in each phase of the cell cycle and sub-G1. All experiments were performed in duplicate and yielded similar results. Original images of cell cycle distribution in A549 cells are presented. (B) The percentage of cells in S phase is presented as the mean ± SD from three various experiments in A549 cells. *P<0.05, compared with the respective controls. PD, polydatin.