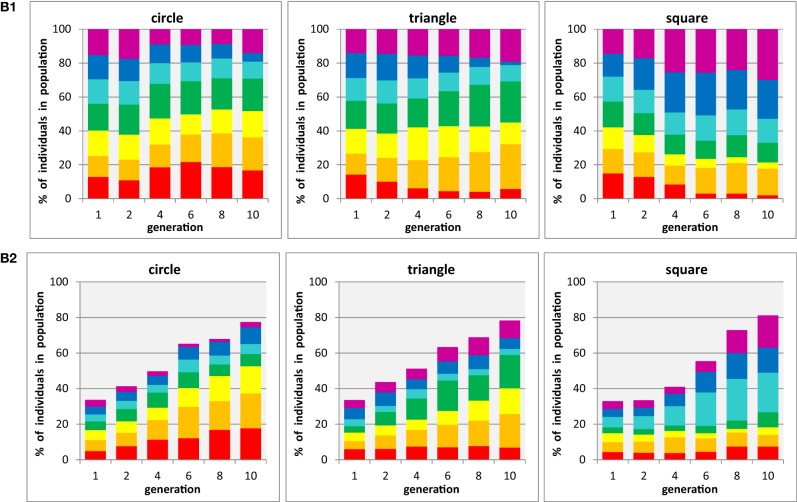
Figure 4.
Evolution of populations with three shapes × seven colors. (B1) three shapes are tested in separate populations containing a single shape each (i.e., participants are asked to select the preferred individual from seven color-shape combinations with identical shape). (B2) three shapes are tested in mixed populations containing all shapes (i.e., participants select the preferred color-shape combination of a given shape in the presence of both other shapes, combined with the same set of seven colors: 21 color-shape combinations). Each panel shows for one particular shape (circle, triangle, square) the development of color proportions of red, orange, yellow, green, cyan, blue, and magenta individuals (shown as stacked bars) in an evolutionary run, displayed for generations 1, 2, 4, 6, 8, and 10 (abscissa). Averages from n = 6 participants.

