
FIGURE 3.
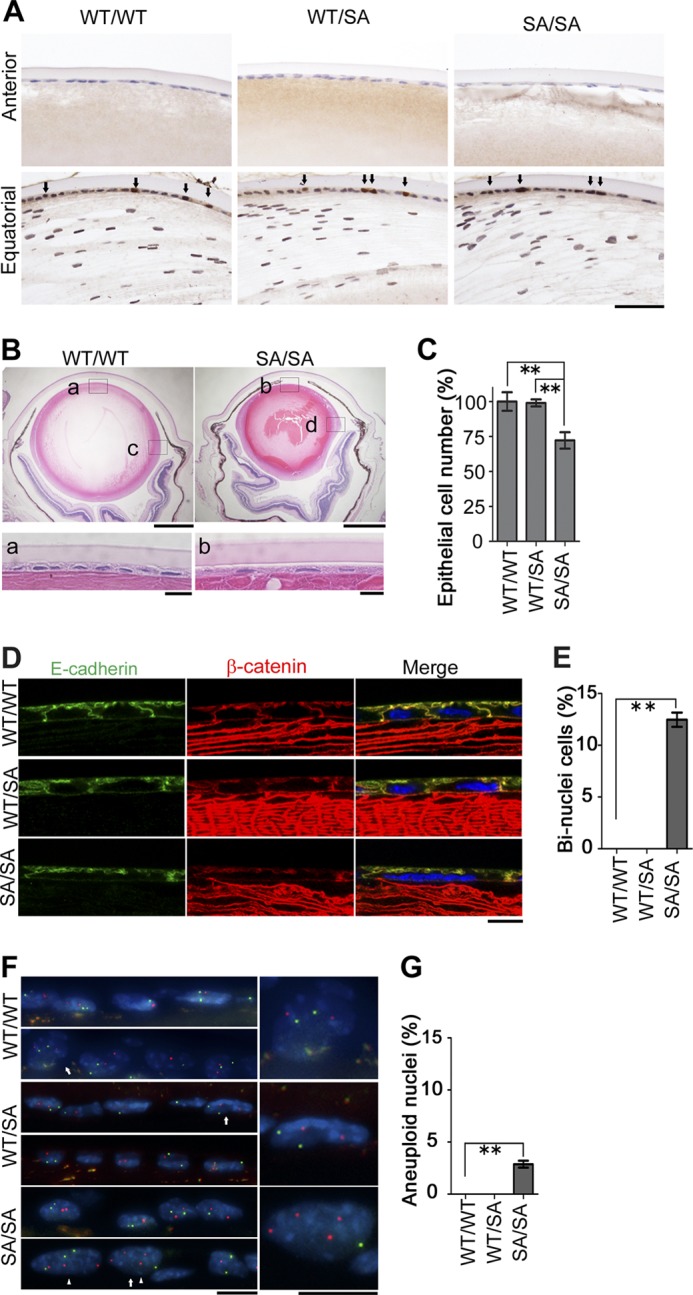
Changes in the epithelial cells in the anterior region of VIMSA/SA lenses. A, active dividing site of lens epithelium. Cells in lens tissue were stained with anti-PCNA. Arrows indicate PCNA-positive nuclei. B, microophthalmia in the VIMSA/SA mice. Lens from 4-month-old VIMWT/WT or VIMSA/SA mice was stained with H&E. Magnified images of anterior or equatorial regions of lens are also shown below (a and b) or in Fig. 4A (c and d), respectively. C, bar graph shows the cell number of epithelium per 500 × 100 μm area, normalized to VIMWT/WT mice (n = 3 mice per genotype); we observed at least 10 sections per each lens for the calculation. D and E, immunostaining (D) of lens epithelial cells with anti-E-cadherin (green), anti-β-catenin (red), and DAPI (blue; nuclei). Bar graph (E) shows the percentage of binucleate cells per 500 × 100 μm area; we observed at least 10 sections per each lens for the calculation (n = 3 mice per genotype). E–G, FISH analyses of nuclei in each genotype of mice. Green or red color represents mouse chromosome 12 or 19, respectively (G). Magnified images of nuclei indicated as arrows are shown at right. Arrowheads indicate aneuploid nuclei (F). Quantification of aneuploid nuclei is also shown (G; n = 3 mice per genotype). Scale bars, 50 μm (A), 500 μm (B, upper), 40 μm (B, lower), or 10 μm (D and F). **, p < 0.01.