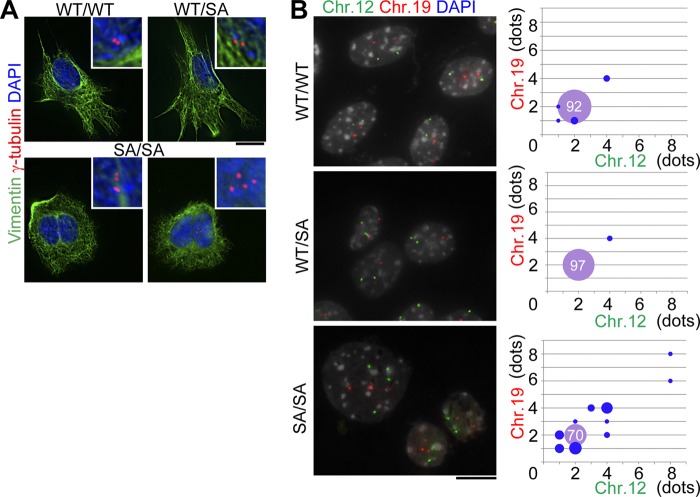
FIGURE 5.
Analysis of primary lens epithelial cell culture. A and B, lens epithelial cells were primarily cultured for 7 days and then subjected to immunostaining (A) or FISH analyses (B). Upper insets indicate magnification images around centrosomes in each cell (A). Cells were classified as the numbers of chromosome (Chr.) 12 and 19 according to FISH data (left photographs in B). The proportion of each category is indicated as the size of circle (right scattered graph in B; n = 100 nuclei per genotype). The percentage of normal diploid (with each two chromosomes) is shown in the violet circle (right graph in B). Scale bars, 10 μm (A and B).

