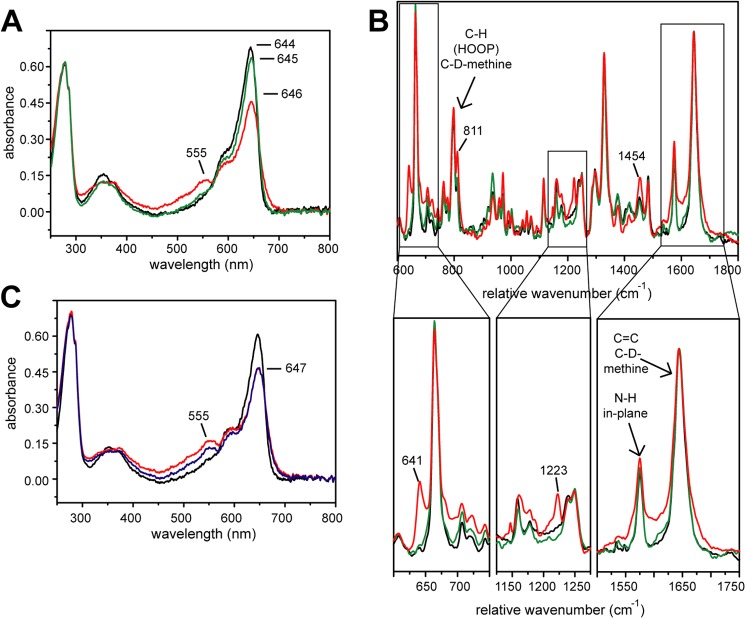
FIGURE 6.
Temporary radiation effect on SynCph2(1–2). Black, no x-ray; red, after x-ray; green, after annealing; blue, 60 s after exposure. A, UV-visible absorbance spectra of a crystal before x-ray, after 60 s exposure (ID 14-1 (ESRF, Grenoble), 100% transmission; flux: ∼4.2 × 10¹⁰ photons/s (approximately ∼1.4 × 10¹⁰ photons/s reached the crystal)), and after 3 s of annealing in the dark (annealing process was not complete). B, Raman spectra of a crystal before x-ray, after 30 min x-ray irradiation (ID 14–1 (ESRF, Grenoble), 100% transmission, 4-s exposure time per image, 350 images, 0.5° oscillation range; flux: ∼4.8 × 10¹⁰ photons/s) and after 4 s of annealing in the dark; below: partial scale-up of the Raman spectra. C, UV-visible absorbance spectra of a crystal before x-ray, after exposition for 60 s, and 60 s after exposure.

