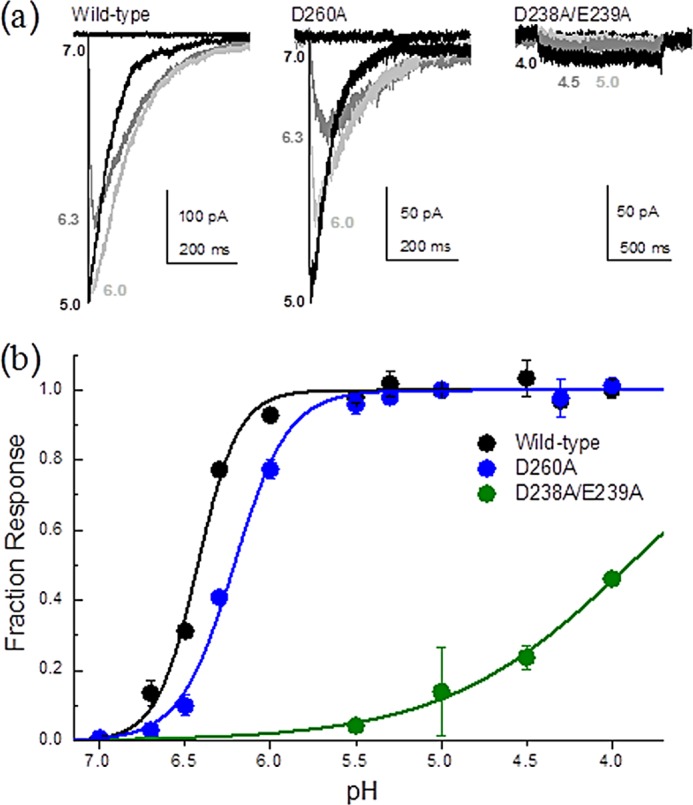
FIGURE 6.

pH dependence of activation in carboxylate mutants. a, example responses from patches containing wild-type ASIC (left panel), D260A (middle panel), and D238A/E239A in the 139/340 LRET background (right panel) at the indicated pH values. b, summary of pH-response curves for wild-type ASIC (black), D260A (blue), and D238A/E239A in the 139/340 LRET background (green). Each point is an average of 3–15 patches.
