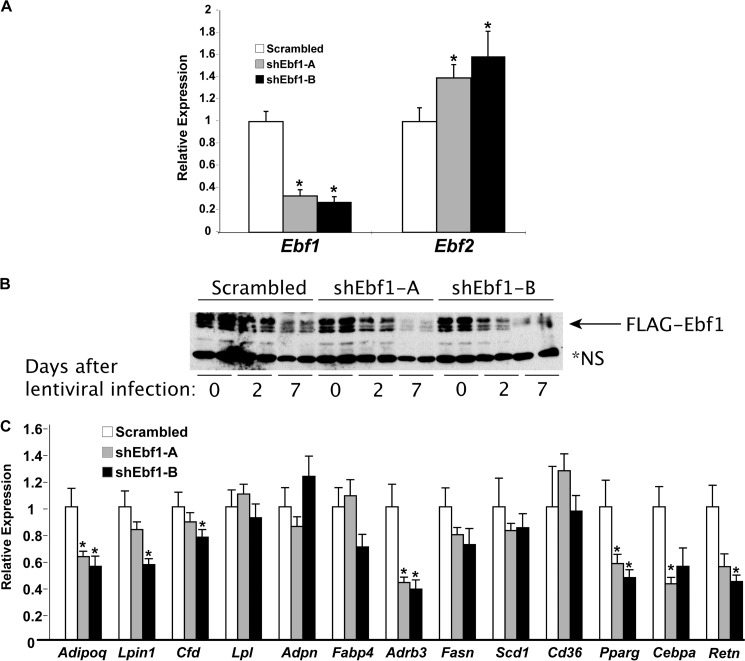
FIGURE 1.
Ebf1 knockdown and selected adipocyte-enriched gene expression in EBF1-deficient cells. A, expression of Ebf1 and Ebf2 by qPCR in the same RNA samples used for the microarray. Error bars, S.E.; *, p < 0.05. B, time course of EBF1 protein decay in shEbf1-treated cells. *NS, nonspecific band. C, expression of several adipocyte-enriched transcripts by qPCR, using the same RNA samples used for the microarray. Error bars, S.E.; *, p < 0.05.

