FIGURE 3.
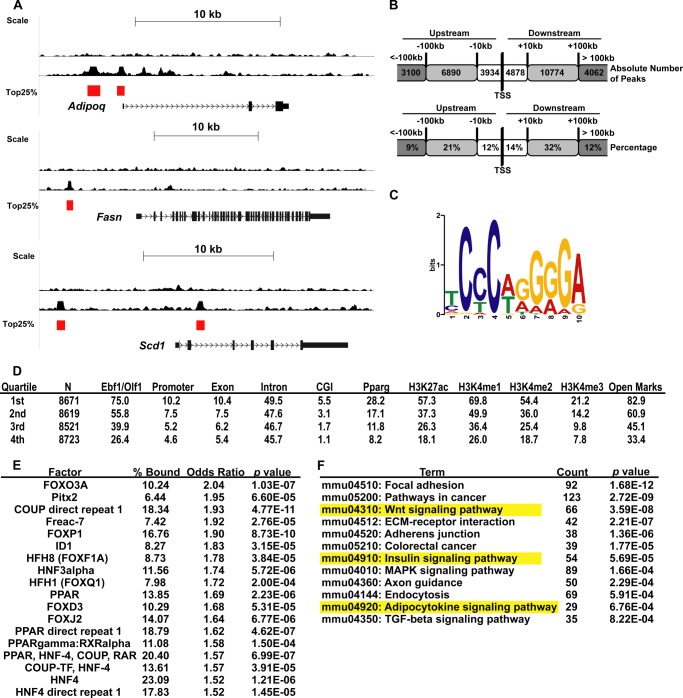
Genome-wide EBF1 ChIP-seq in 3T3-L1 adipocytes. A, genome browser tracks of selected genes of interest. Peak calls scoring in the top quartile by amplitude are marked with a red bar. B, chart showing distribution of EBF1 binding sites expressed as absolute numbers (top) or percentages (bottom). C, position-weight matrix of the most common motif found underneath all peaks in our study. D, table showing the percentage of EBF1 binding sites found associated with various motifs and histone modification marks, arranged by quartile. N, number of peaks in each quartile. All other values represent percentages of the number of peaks in that quartile. E, table showing all non-EBF1 motifs associated with the top quartile of peaks, ±300 bp. % bound, percentage of peaks that feature the indicated motif, arranged in order of decreasing odds ratio. F, DAVID analysis of ChIP-seq data. All genes associated with top quartile EBF1 peaks were subjected to DAVID analysis. The most significantly enriched KEGG pathways (p < 0.001) are arranged in order of increasing p value; pathways also scoring significantly in the GSEA (Fig. 2C) are highlighted.

