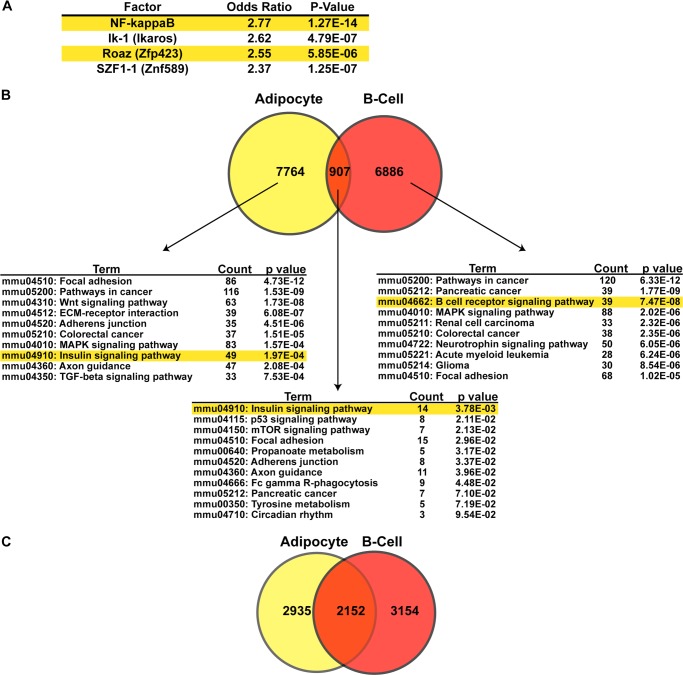
FIGURE 4.
Motif analysis and comparison with EBF1 cistrome in B-cells. A, motifs that co-occur with EBF1 ± 50bp. We analyzed all EBF1-containing first quartile peaks for enrichment of other TF motifs at an interval of ±50 bp using the TRANSFAC database. All sites recognized by transcription factors not found in mice or scoring an odds ratio of <1.5 were filtered from the lists. Enriched sites are sorted according to decreasing odds ratio. B, Venn diagram comparing the number of peaks in our first quartile versus the three other published B-cell data sets and DAVID analysis of the genes associated with the adipocyte-specific peaks, the common peaks, and the B-cell-specific peaks. Note than any given gene may fall into all three categories as long as it is associated with at least one of each type of peak. Only the top 10 most significantly enriched KEGG pathways are shown. C, Venn diagram comparing the number of genes bound by EBF1 in fat (associated with the first quartile of peaks) versus the number of genes bound by EBF1 in B-cells (also associated with the first quartile of peaks).

