FIGURE 7.
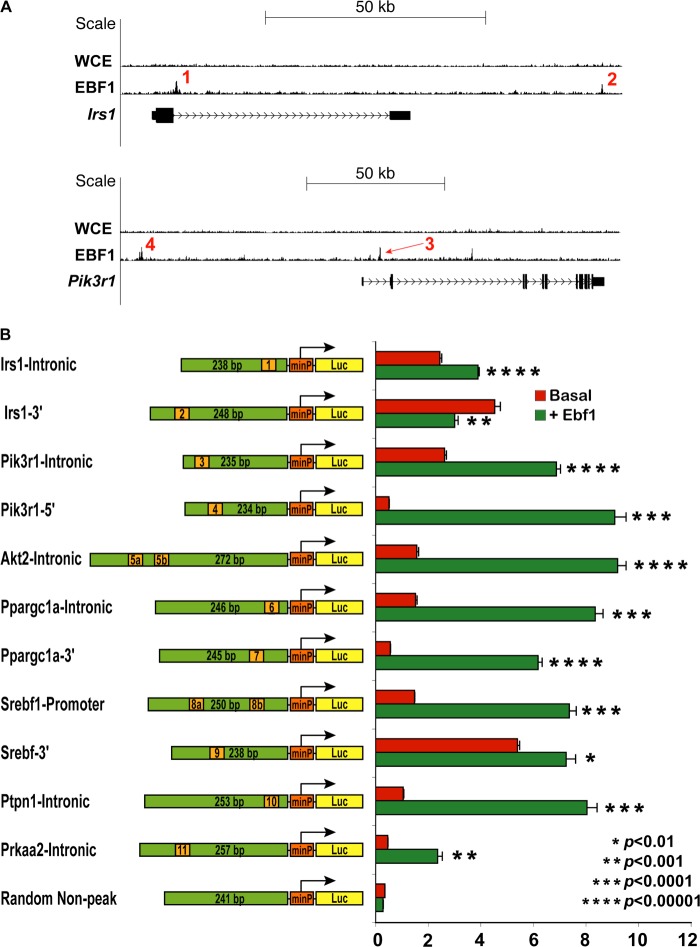
Validation of EBF1 responsiveness to sequences underneath EBF1 peaks in vitro. A, genome browser tracks of select loci of interest. Numbers indicate specific peaks chosen for further analysis. WCE and EBF1 ChIP are shown. B, schematic of luciferase constructs used for in vitro luciferase assays and the corresponding results, shown in bar graph format. Green bars, relative size of the cloned fragments underneath the selected peaks; orange marks, approximate position of the putative EBF1 motifs (not to scale). In cases where there were two consensus EBF1 sites underneath the identified peak sequence, the two sites are labeled as 5a, 5b, etc. Details regarding the specific genomic coordinates corresponding to each cloned fragment can be found under “Experimental Procedures.” For activation assay experiments, 293T cells were transfected with each construct with or without Ebf1 in quadruplicate. Results are shown as absolute activation relative to cells transfected with equivalent amounts of empty vector, along with the indicated reporter construct.

