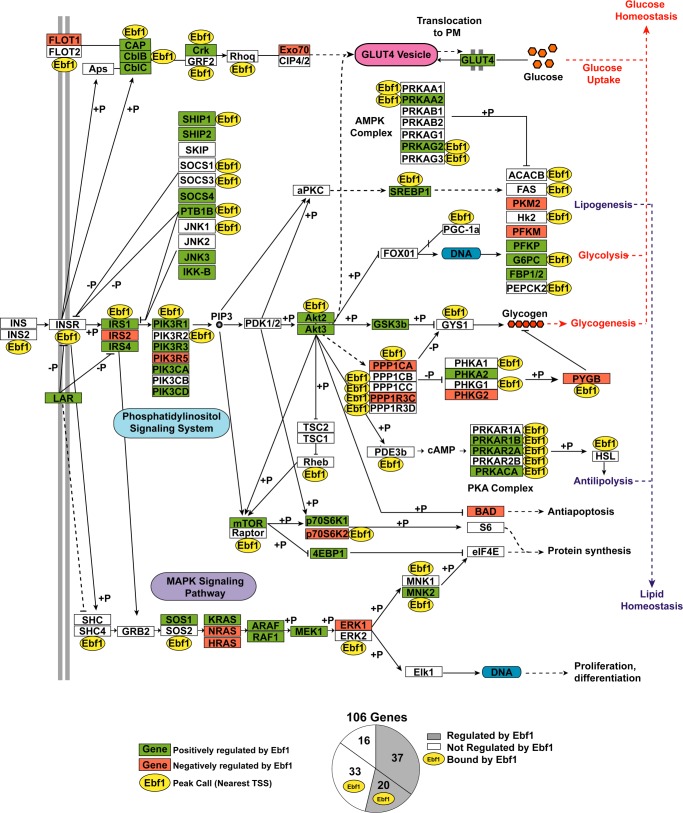
FIGURE 9.
Schematic of genes in the insulin signaling KEGG pathway that are directly or indirectly regulated by EBF1. Shown is a modified insulin signaling pathway depicting integrated results obtained from microarray/GSEA and EBF1-ChIP-seq. Genes that are positively regulated by EBF1 are shown in green, genes that are negatively regulated by EBF1 are shown in red, and genes that EBF1 binds to directly (as determined by ChIP-seq) are marked with a yellow oval Ebf1 symbol. The pie chart on the right depicts the number of genes falling into each of four possible categories (see “Discussion”).

