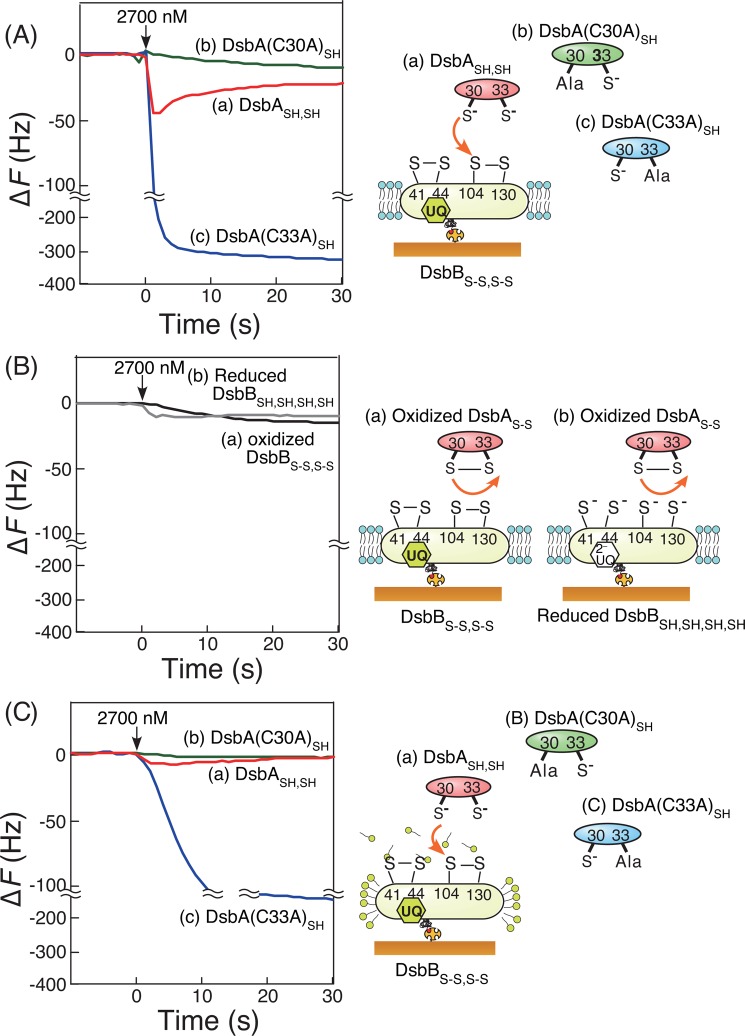
FIGURE 3.
Typical time courses of frequency decreases (mass increases) in QCM experiments. Shown are the reaction of DsbBS-S,S-S embedded in supported bilayers (A), reaction of DsbBS-S,S-S (a) and the reduced DsbBSH,SH,SH,SH (b) embedded in supported bilayers in response to the addition of the oxidized DsbAS-S (B), and DsbBS-S,S-S covered with DDM micelles, responding to the addition of DsbASH,SH (a), DsbA(C30A)SH (b), and DsbA(C33A)SH (c), respectively (C). All experiments were carried out under the same conditions (50 mm citrate, pH 6.0, and 100 mm NaCl at 25 °C, [DsbA] = 2700 nm in 500 μl, and [DsbB] = 16 pmol/cm2 on the QCM plate).

