
FIGURE 2.
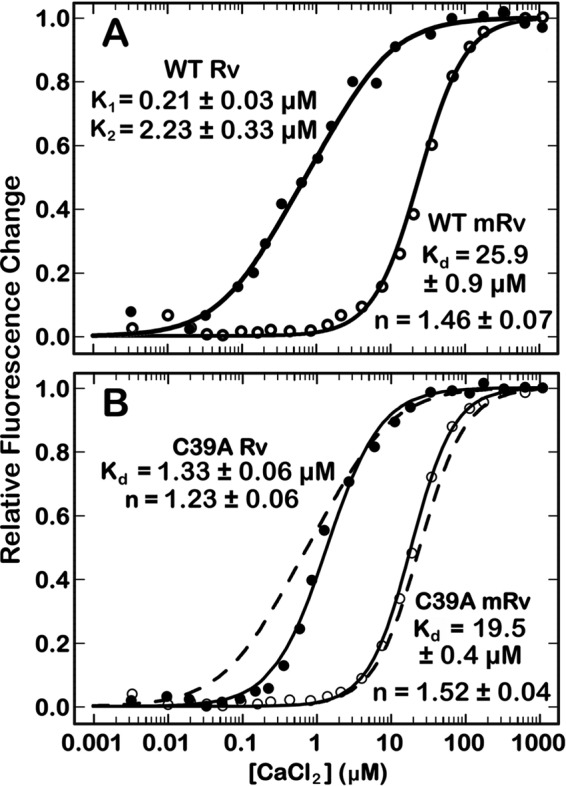
Normalized change in fluorescence for Ca2+ binding to myristoylated (open) and non-myristoylated (filled) WT (A) or C39A (B) recoverin. Equation 1 was used to fit titration data for WT mRv, C39A mRv, and C39A Rv. Equation 2 was used to fit the titration data for WT Rv. The dashed lines in B represent the WT titration data from A for comparison.