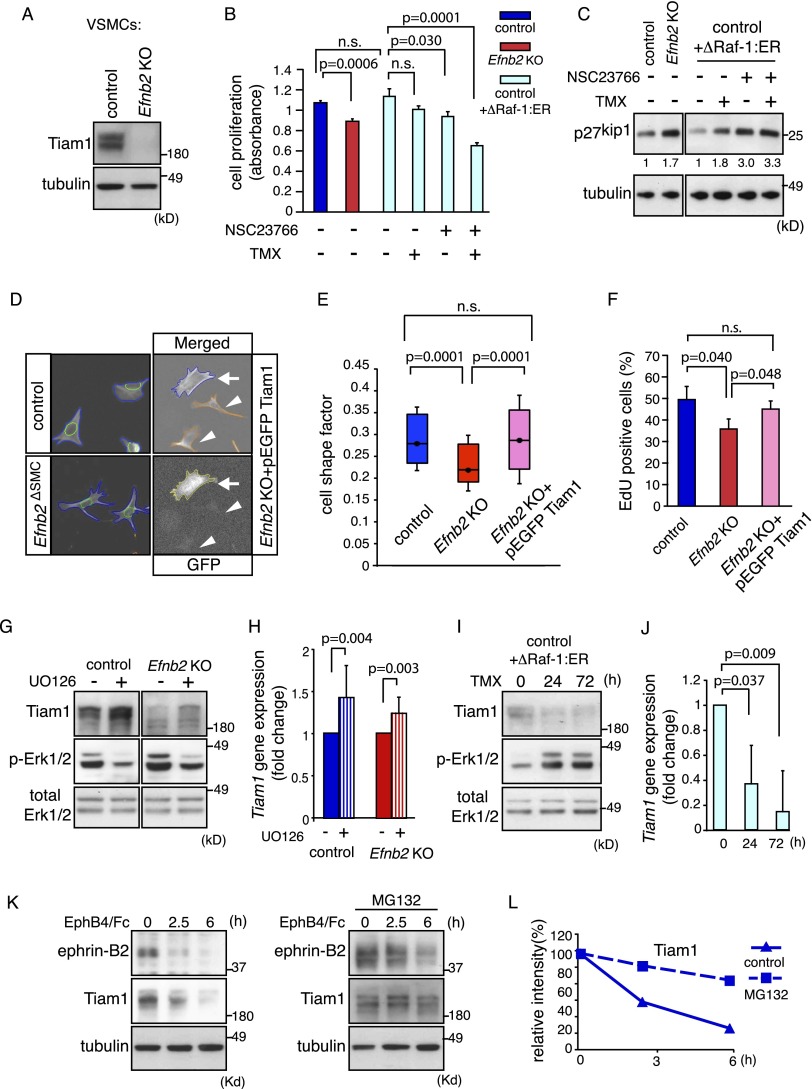
Figure 2.
Regulation of VSMC proliferation by Tiam1–Rac1 and MAP kinase. (A) Western blot showing strongly decreased Tiam1 protein levels in Efnb2 knockout VSMCs. Tubulin is shown as a loading control. Molecular weight markers are indicated. (B) Cell proliferation (measured by the detection of cleaved tetrazolium salts) was reduced by Rac1 inhibitor (NSC23766) as well as simultaneous up-regulation of Erk1/2 activity (ΔRaf1:ER+tamoxifen [TMX]). P-values were calculated using ANOVA with Tukey's post-hoc test (n = 3). Error bars indicate SD. (C) Levels of the cell cycle inhibitor p27kip1 were increased by Rac1 inhibition and were not restored by Erk1/2 activation (ΔRaf1:ER+TMX) in cultured murine VSMCs. Tubulin is shown as a loading control. Densiometric readings for p27kip1 bands and molecular weight markers (in kilodaltons) are indicated. (D) Images of automatic cell shape analysis. Phalloidin-stained VSMCs (blue) and DAPI-stained nuclei (green) were segmented. Arrows mark Efnb2 knockout cells that express pEGFP-Tiam1 (yellow); arrowheads in the images at the right indicate rejected cells due to undetectable GFP expression. (E) Box-and-whiskers diagram of shape factor data of D. A dot marks the median, the box spans 30% of the values, and whiskers span 50% of the values. P-values were calculated using ANOVA and Tukey's post-hoc test (control, n = 263; knockout [KO], n = 263; KO+pEGFP Tiam1, n = 232). Smaller shape factor of Efnb2 cells was rescued by re-expression of Tiam1. (F) Re-expression of Tiam1 restored cell proliferation defects (measured by 2 h of EdU incorporation) in Efnb2 knockout smooth muscle cells. P-values were calculated using ANOVA (n = 3). Error bars indicate SD. (G) Western blot showing increased Tiam1 protein after Erk1/2 inhibition (U0126) for 24 h. Total Erk1/2 and p-Erk1/2 bands, which were strongly reduced by U0126, are shown below. (H) Quantitative PCR (qPCR) of Tiam1 expression in control or Efnb2 knockout VSMCs incubated with U0126 for 24 h. P-values were calculated using two-tailed Student's t-test (n = 3). Error bars indicate SD. (I,J) Western blot (I) and qPCR results (J) showing reduced Tiam1 levels after Erk1/2 activation (ΔRaf1:ER+TMX) for the indicated times. P-values were calculated using two-tailed Student's t-test (n = 3). Error bars indicate SD. (K) Tiam1 and ephrin-B2 protein levels were decreased after stimulation of VSMCs with EphB4/Fc for the indicated times (left), which was strongly reduced after administration of MG132 (right). (L) Densiometric analysis of data shown in K.

