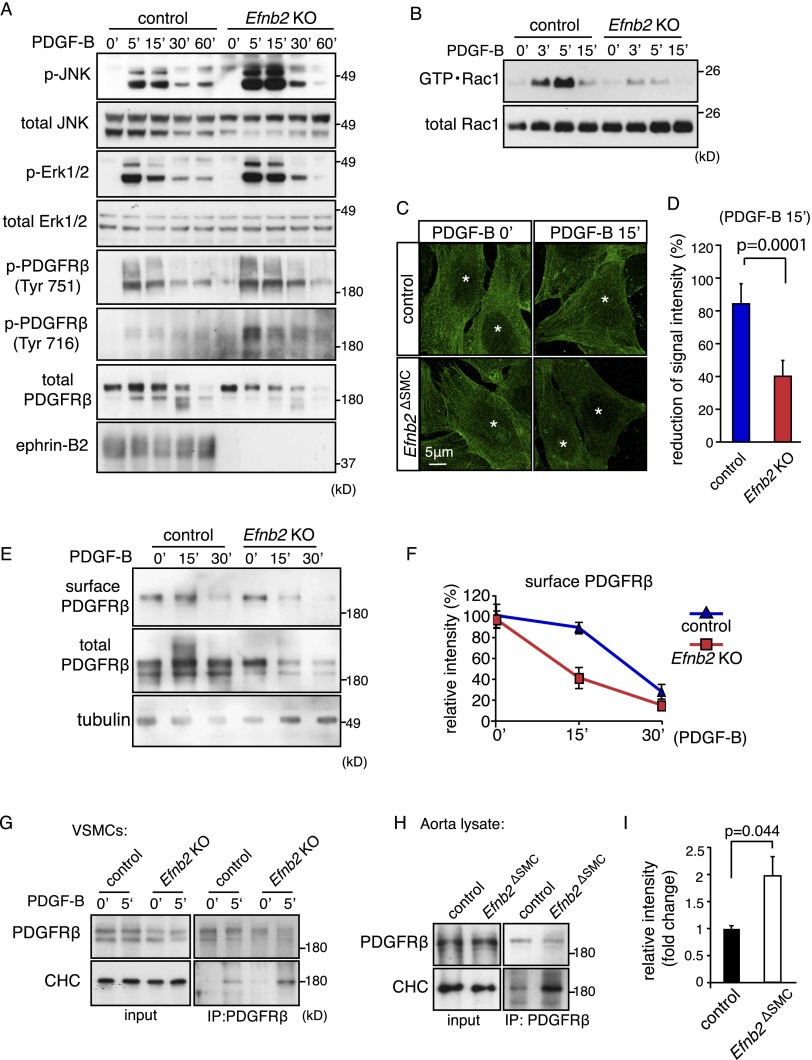
Figure 3.
Ephrin-B2 negatively regulates PDGFRβ signaling and internalization. (A) Western blot showing increased activation of JNK, Erk1/2, and PDGFRβ in PDGF-B-stimulated Efnb2 knockout compared with control VSMCs. (Bottom) Ephrin-B2 bands were absent in knockout cells. Molecular weight markers (in kilodaltons) are indicated at the right. (B) PDGF-B-induced activation of Rac1 (GTP • Rac1) was strongly diminished in Efnb2-deficient VSMCs. Time points after stimulation and molecular weight markers are indicated. Total Rac1 is shown as a loading control. (C) Immunofluorescence on cultured VSMCs showing accelerated removal of cell surface PDGFRβ (green; nonpermeabilized cells) in Efnb2 knockout cells at 15 min (15′) after PDGF-B stimulation. (*) Nuclei. (D) Statistical analysis of surface PDGFRβ signals shown in C. P-values were calculated using two-tailed Student's t-test (n = 5). Error bars indicate SD. (E,F) Biochemical detection of surface (biotinylated) and total PDGFRβ in PDGF-B-stimulated control and Efnb2 knockout VSMCs (E) and quantitation of band intensities (normalized to 0′) (F). (G) Western blot showing enhanced coimmunoprecipitation of CHC with PDGFRβ at 5 min after PDGF-B stimulation in cultured murine Efnb2 knockout and control cells. (H,I) Western blot showing enhanced coimmunoprecipitation of CHC with PDGFRβ from Efnb2ΔSMC aorta lysate relative to control (shown in H). Input is shown at the left, and molecular weight markers (in kilodaltons) are indicated at the right. (I) Densiometric analysis of immunoprecipitated CHC. P-values were calculated using two-tailed Student's t-test (n = 3). Error bars indicate SD.

