Figure 4.

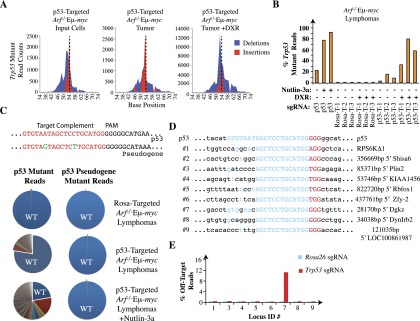
Analysis of indels at the Trp53 locus and at predicted off-target sites in Arf−/−MEFs and Arf−/−Eμ-myc tumors edited with Rosa26 and Trp53 sgRNAs. (A) Total count and location of insertions and deletions in exon 7 of Trp53 in Arf−/−Eμ-myc cells prior to injection, post-implantation, and post-DXR treatment, respectively. The vertical dashed line represents the predicted Cas9 cleavage site. (B) Frequency of mutant reads obtained following sequencing of Trp53 exon 7 from the indicated cells and tumors. T-1, T-2, and T-3 represent three independent tumors. (C, top panel) Sequence alignment of the trigger site in the Trp53 and Trp53 pseudogene. Differences are highlighted in green. (Bottom panel) Pie charts illustrating the proportion of mutated sequence reads at Trp53 (left) and the Trp53 pseudogene (right) relative to wild-type sequences (wt; blue). DNA was isolated from samples of Arf−/−Eμ-myc lymphoma cells infected with QCiG-Rosa-infected (top), QCiG-p53-infected (middle), or QCiG-p53-infected cells that were exposed to 10 μM Nutlin-3a for 3 d followed by a 10-d recovery period (bottom). (D) Prediction of genomic sequences showing sequences complementary to the first 13 perfectly matched nucleotides 5′ to the PAM of the Trp53 trigger sequence with all possible combinations of PAM. The trigger sequence is shown in blue, PAM is in red, and flanking nucleotides are in black. The genomic location is shown at the right. (E) Percent mutant reads at the indicated genomic locus in Rosa26- and Trp53-modified Arf−/− MEFs. The total read count for each amplified region ranged from ∼11,000 to 15,000 (sample #8), ∼18,000 to 23,000 (sample #7), and ∼20,000 to 53,000 (all others). Read counts for locus #2 are absent, since the barcode that had been used in the preparation of that sample could not be deciphered from the output of reads.
