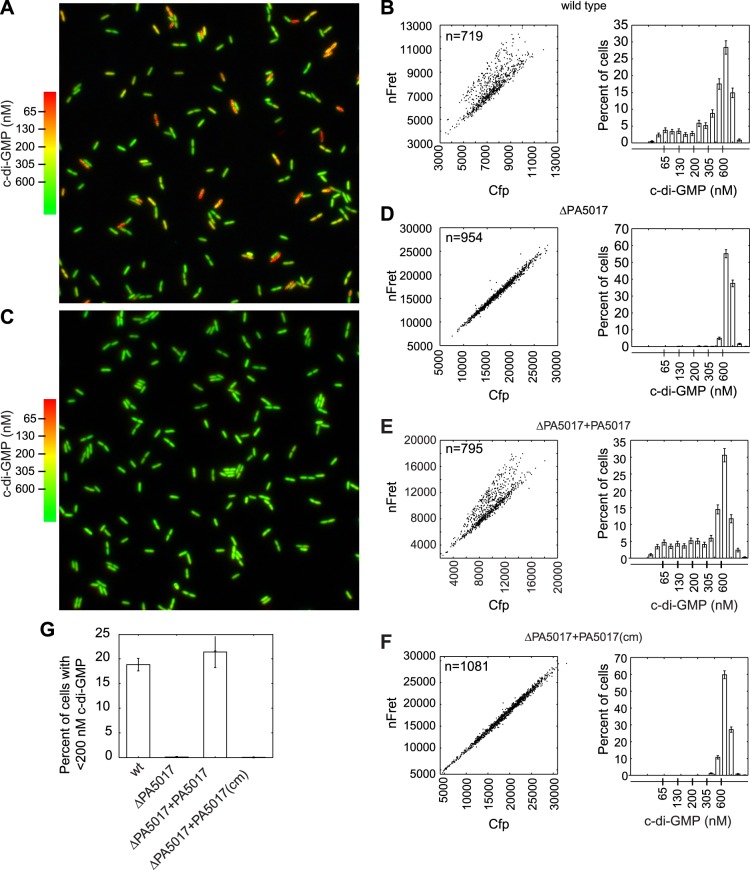
Figure 1. PA5017/pch is required for heterogeneity in c-di-GMP levels.
(A) Wild-type P. aeruginosa cells exhibit heterogeneity in c-di-GMP levels. Pseudocolored nFret/Cfp ratios from a single field (88.7 × 88.7 microns) demonstrate c-di-GMP concentrations in wild-type P. aeruginosa PA14 cells. (B) Quantification of cellular c-di-GMP levels in wild-type P. aeruginosa cells. The left panel shows a scatter plot of the mean nFret vs Cfp values in individual cells. In the right panel is a histogram of the corresponding cellular c-di-GMP levels where error bars depict the counting error. Graphs in (D), (E), and (F) assume the same format. (C) c-di-GMP concentrations in the PA5017 deletion. (D) Quantification of c-di-GMP concentrations in ΔPA5017 cells. (E) Quantification of c-di-GMP concentrations in ΔPA5017 complemented with PA5017. (F) Quantification of c-di-GMP concentrations in ΔPA5017 complemented with a catalytic mutant (cm) of PA5017. (G) Quantification of the mean percentage of cells with less than 200 nM c-di-GMP from three biological replicates. Error bars depict the standard deviation.

