Figure 5. CheA forms a complex with Pch and relies on flhF for polar placement.
(A) Representative images (10.8 × 10.8 microns) of CheA-mTq and Pch-Yfp localization in wild-type (top) and ΔflhF (bottom) strains. In the phase/fluorescence channel overlays, CheA-mTq fluorescence is shown in blue and Pch-Yfp fluorescence is shown in red. (B) Histogram of the smallest distance between any two CheA-mTq and Pch-Yfp foci in wild-type and ΔflhF strain backgrounds. (C) Histogram of the CheA-mTq foci distance to the nearest cell pole in wild-type and ΔflhF strain backgrounds. In (B) and (C) error bars depict counting error. (D) Percent of cells exhibiting polar localization of CheA-mTq in wild type and ΔflhF strain backgrounds from three biological replicates. Strains contain empty vector (pVC) or a complementing plasmid. Error bars depict the standard deviation. (E) Co-immunoprecipitation of CheA-mTq and Pch-VSV-G. CheA-mTq of the input lysates and anti VSV-G agarose bead elution fractions was detected by western blot utilizing a monoclonal anti-GFP antibody. Lanes 1–4 show control isolates lacking a CheA-mTq fusion. Lanes 1, 2 and 5, 6 show protein complexes eluted from anti VSV-G agarose beads.

Figure 5—figure supplement 1. CheA localizes to the same pole as FliM.

Figure 5—figure supplement 2. CheA-mTq colocalizes with Pch-mCherry but not with FliM-mKate2.
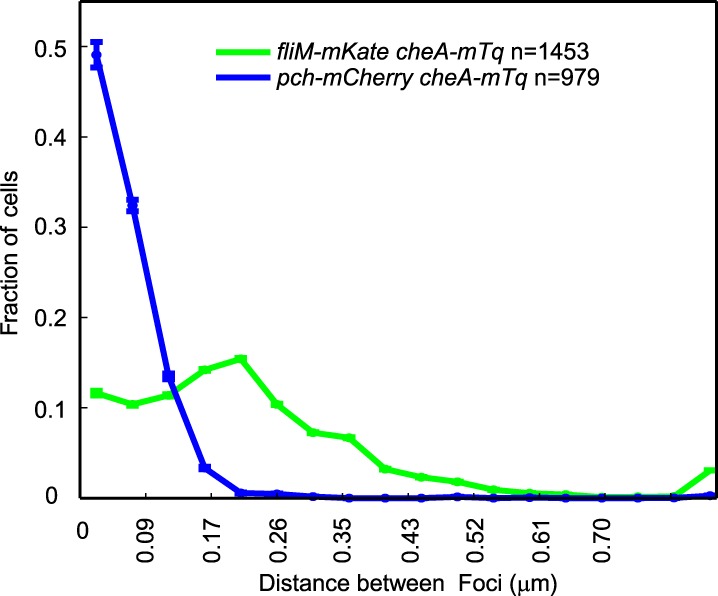
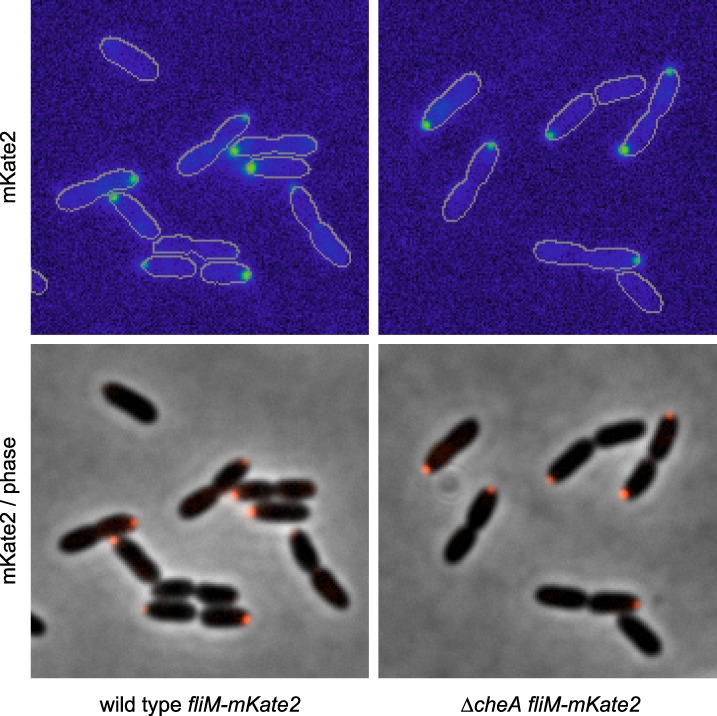
Figure 5—figure supplement 3. FliM-mKate2 polar localization is not dependent upon CheA.