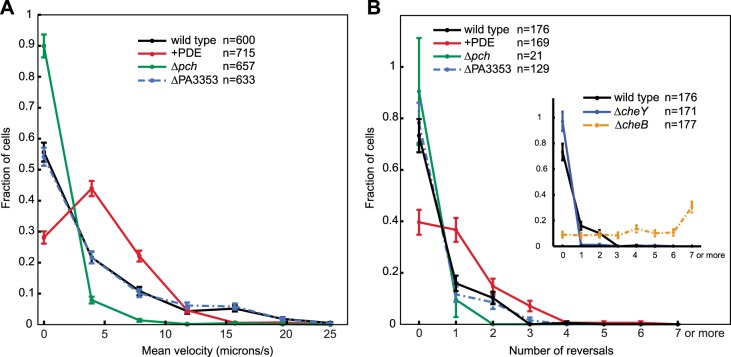
Figure 6. Cells with increased c-di-GMP exhibit decreased velocity and reversals.
(A) Histogram of mean cellular velocity. The ‘+PDE’ strain uniformly exhibits cellular c-di-GMP concentrations less than 65 nM. (B) Histogram of total number of reversals exhibited during 25 micron trajectories. Only cells moving at a velocity of 2 microns/s or greater were analyzed. Reversal data from the control strains are shown in the inset box. The cheY deletion is not expected to undergo any reversals. The cheB deletion is expected to undergo more reversals than wild type. Error bars depict the counting error. Representative graphs are shown for both (A) and (B).

