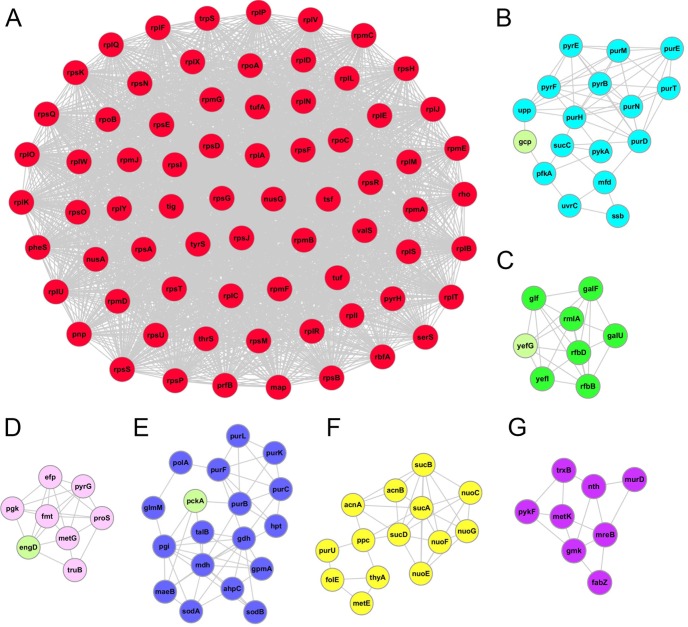
Fig. 5.
The top seven clusters of highly interconnected lysine-succinylated protein networks. Interaction network of lysine-succinylated proteins (listed in gene names) were analyzed using the MCODE plug-in toolkit in the Cytoscape software (version 3.0.1). The lysine-succinylated proteins in the top seven clusters are shown in red, light blue, green, pink, blue, yellow, and purple, respectively. Proteins without a succinylation site are indicated in light green in each cluster. A, cluster 1: MCODE score = 32.197, nodes = 71, edges = 2,286. B, cluster 2: MCODE score = 3.235, nodes = 17, edges = 55. C, cluster 3: MCODE score = 3, nodes = 8, edges = 24. D, cluster 4: MCODE score = 2.75, nodes = 8, edges = 22. E, cluster 5: MCODE score = 2.722, nodes = 18, edges = 49. F, cluster 6: MCODE score = 2.571, nodes = 14, edges = 36. G, cluster 7: MCODE score = 1.75, nodes = 8, edges = 14. The detailed cluster information is listed in supplemental Table S5.

