
Fig. 7.
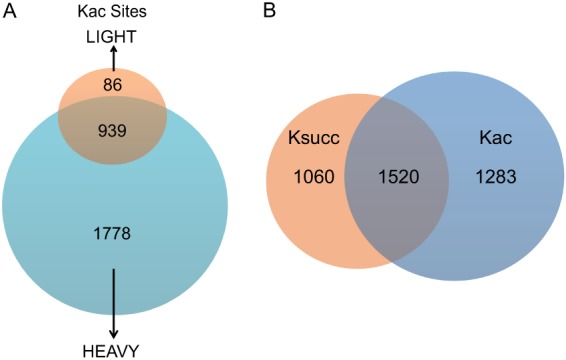
Quantitative analysis of E. coli acetylome. A, Venn diagram showing the total number of heavy-only (63.4%), light-only (3.1%), and overlapping (33.5%) lysine acetylation sites. B, Venn diagram showing the number of Ksucc-only, Kac-only, and overlapping sites between the two modifications.