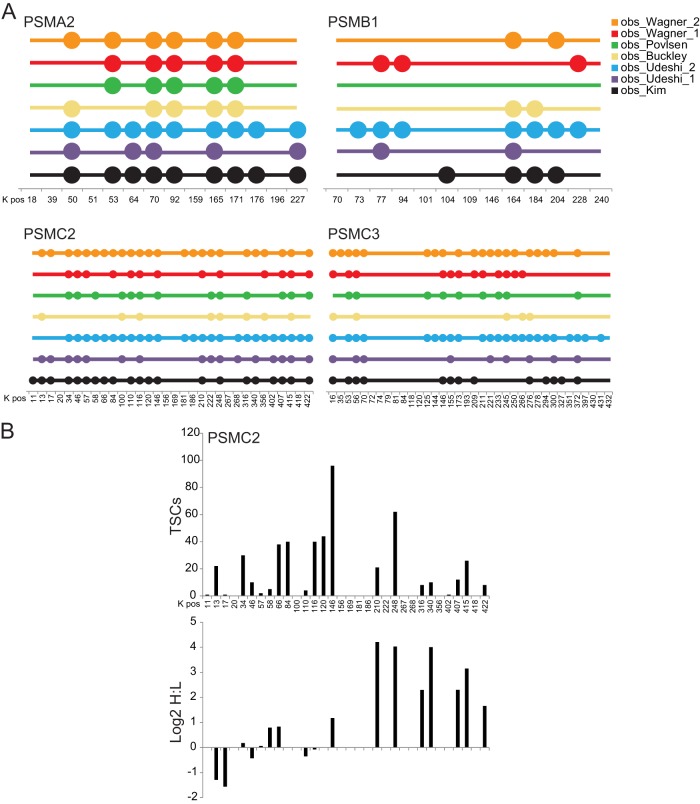
Fig. 2.
Ubiquitin-modified site heterogeneity. A, the position of each lysine residue for the indicated proteins is indicated on the x-axis. Each colored circle signifies that the lysine indicated was observed to be ubiquitin-modified within the studies of Kim et al. (black) (22), Wagner et al. (red) (31), Povlsen et al. (green) (27), Udeshi et al. (purple) (29), Udeshi et al. (blue) (30), Wagner et al. (orange) (32), and Buckley et al. (yellow) (23). B, total spectral counts (TSCs; top) and the log2 SILAC ratio (heavy (H) = treated with 1 μm bortezimib; light (L) = untreated) for all lysine residues within PSMC2.The number indicates the position of the lysine residue, starting with the initiator methionine. All primary data used for this figure were extracted from the published diGLY-modification data set of Kim et al. (22).

