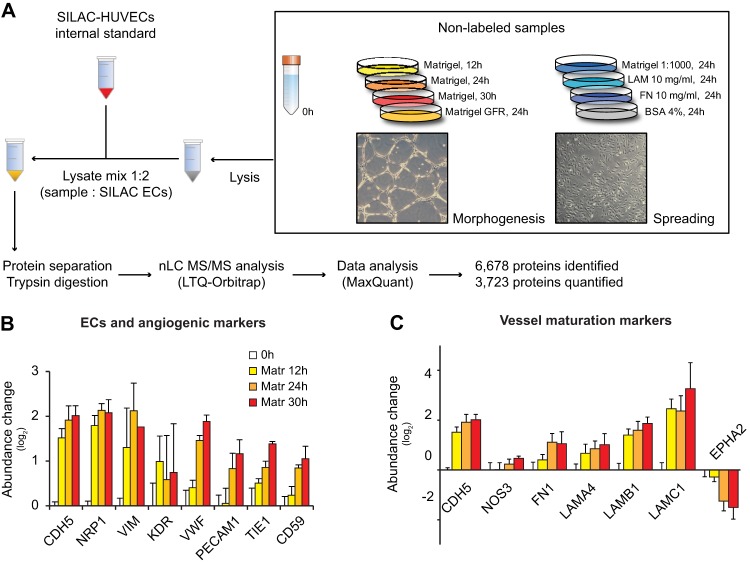
Fig. 1.
SILAC-based quantitative proteomics identifies proteome changes in HUVECs morphogenesis and spreading. A, The right panel depicts the adhesion conditions analyzed with MS. Phase contrast pictures are representative of HUVECs forming capillary-like network (tubule morphogenesis) and spreading on ECM-coated dish. The workflow shows the main steps of sample preparation and MS analysis. Identified and quantified proteins were obtained from three independent experiments. B, C, Changes in abundance of protein markers for ECs and angiogenesis (B), and vessel maturation (C). Protein levels are represented as average of the Sample/SILAC ratio in the three experiments, normalized by the average protein amount at time 0 (0h/SILAC ratio). Bars indicate the S.D. (n > = 2).

