Fig. 4.
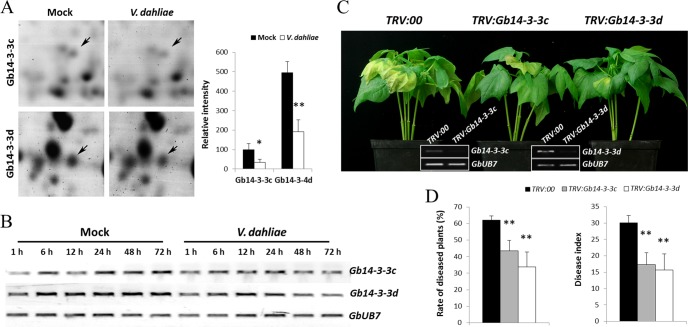
Silencing of Gb14-3-3 enhances cotton resistance to V. dahliae. A. Shown are representative protein spots (Gb14-3-3c, Gb14-3-3d) on inoculation with V. dahliae and quantification of the signal intensities obtained from three independent 2-DE maps. Error bars represent the standard deviation of three biological replicates; asterisks indicate statistically significant differences, as determined by the Student t test (*p < 0.05; **p < 0.01). B, RT-PCR analysis of the expression pattern of Gb14-3-3c and Gb14-3-3d at the transcriptional level in G. barbadense cv.7124 on inoculation with V. dahliae. PCR was performed by 28 cycles of amplification for GbUB7 and 30 cycles for other genes. C, Disease symptoms induced on TRV:00, TRV:Gb14-3-3c or TRV:Gb14-3-3d cotton after inoculation with V. dahliae strain V991. Ten-day-old G. hirsutum cvYZ-1 seedlings were hand-infiltrated with Agrobacterium carrying individual genes in the VIGS vector. Two weeks after infiltration, the seedlings were dip-inoculated with V. dahliae. Photos were taken at 9 d after inoculation. D, Rate of diseased plants and disease index measurement of TRV:00, TRV:Gb14-3-3c and TRV:Gb14-3-3d cotton plants after inoculation with conidial suspension of V991 by root dipping method. The rate of diseased plants and disease index were measured at 4 d after the plants beginning to present disease symptoms. Error bars represent the standard deviation of three biological replicates (n ≥ 16); asterisks indicate statistically significant differences, as determined by the Student t test (**p < 0.01).

