Fig. 6.
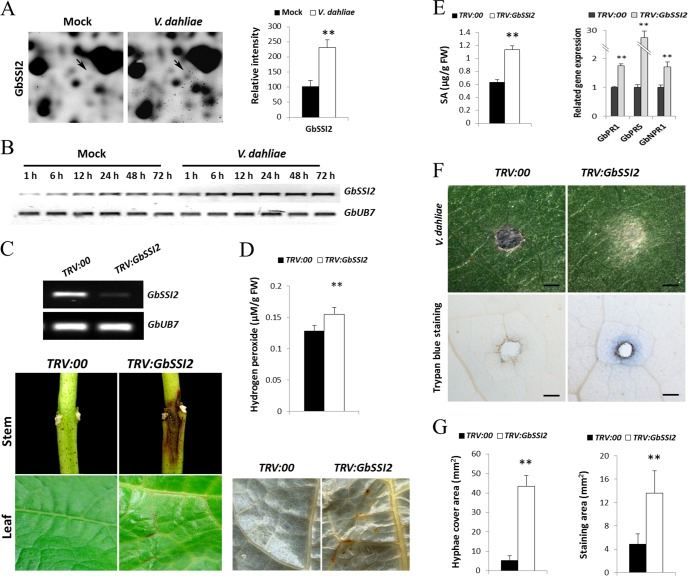
Activation of ROS and SA enhances the susceptibility of GbSSI2-silenced cotton to V. dahliae. A, Shown are representative protein spot (GbSSI2) on inoculation with V. dahliae and quantification of the signal intensities obtained from three independent 2-DE maps. Error bars represent the standard deviation of three biological replicates; asterisks indicate statistically significant differences, as determined by the Student t test (*p < 0.05; **p < 0.01). B, RT-PCR analysis of the expression pattern of GbSSI2 at the transcriptional level in G. barbadense cv7124 on inoculation with V. dahliae. PCR was performed by 28 cycles of amplification for GbUB7 and 30 cycles for GbSSI2. C, Spontaneous lesion formation on the stems and leaves of TRV:GbSSI2 plants. The cotyledons of 10-day-old seedlings of G. barbadense cv7124 were hand-infiltrated with Agrobacterium carrying either TRV:GbSSI2 or VIGS-vector control (TRV:00). Spontaneous lesion was present on the stems and leaves of GbSSI2-silenced plants 12 d after infiltration. RT-PCR analysis indicated that the transcripts of GbSSI2 were reduced 12 d after infiltration. D, DAB staining and measurement of H2O2 accumulation in TRV:00 and TRV:GbSSI2 leaves. Error bars represent the standard deviation of three replicates (n = 12); asterisks indicate statistically significant differences, as determined by the Student t test (**p < 0.01). E, Detection of SA signaling pathway-related genes and alteration of SA levels in TRV:00 and TRV:GbSSI2 plants. Error bars of qRT analysis represent the standard deviation for three independent experiments, and three technical replicates were analyzed; Error bars of SA levels represent the standard deviation of three biological replicates (n = 10); asterisks indicate statistically significant differences, as determined by the Student t test (**p < 0.01). F, Disease symptoms induced on the leaves of TRV:00 and TRV:GbSSI2 cotton plants 3 d after inoculation with spore suspension of V. dahliae (106 conidia per ml). Mycelia growth on leaves inoculated with V991 (Fig. 6F, upper panel). Trypan blue staining of V991-infected leaves (Fig. 6F, lower panel). Scale bars: 1 mm. G, Hyphae cover area and trypan blue staining area of V991-infected leaves. Error bars represent the standard deviation of three replicates (n = 12); asterisks indicate statistically significant differences, as determined by the Student t test (**p < 0.01).

