Fig. 5.

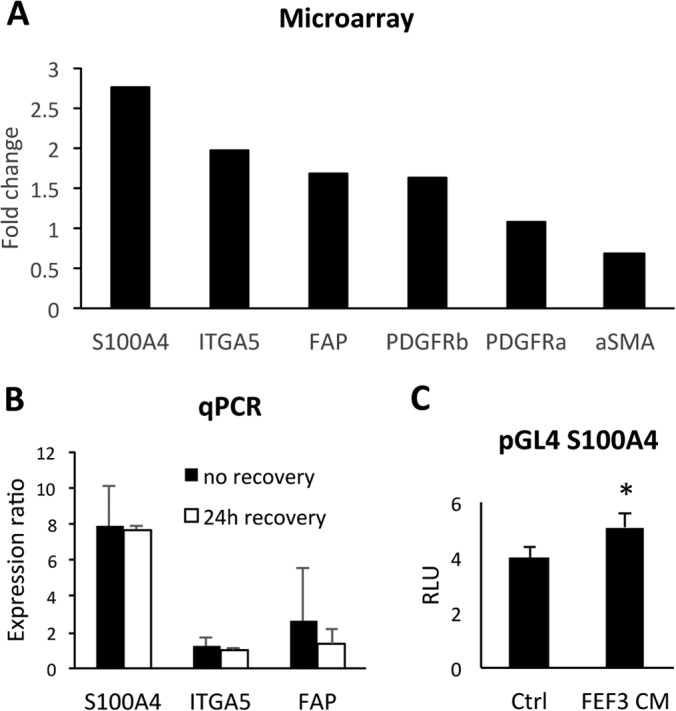
Verification of selected CAF markers on transcriptome level. A, Expression of genes up-regulated in E-cad lo MSP displayed as fold-change relative to E-cad high epithelial cells using Illumina HumanHT-12v3 Beadchips microarray in OCTT2 cells. S100A4 (2.77-fold, p = 1.32 × 10⁹), ITGA5 (1.98-fold, p = 4.99 × 10¹⁰), FAP (1.69-fold, p = 4.22 × 10⁷), and PDGFRβ (1.63-fold, p = 8.46 × 10⁸). B, Validation of S100A4, ITGA5 and FAP mRNA expression by real-time qPCR. Epithelial and mesenchymal subsets from OCTT2 cell line were FASC-segregated and RNA was isolated either directly after cell sort (solid bars) or after 24 h recovery period (open bars). GAPDH was used for normalization, and relative gene expression in MSP was compared with the epithelial subpopulation using REST-MSC software. (S100A4 = 7.89- and 7.77-fold; ITGA5 = 1.2- and 0.99-fold; FAP = 2.59- and 1.35-fold). C, OCTT2 cells transfected with S100A4 promoter construct for 24h, after which culture media was changed to either control or FEF3-CM. Luciferase activity was measured after 48h and normalized to Renilla expression. n = 3, *p < 0.05.
