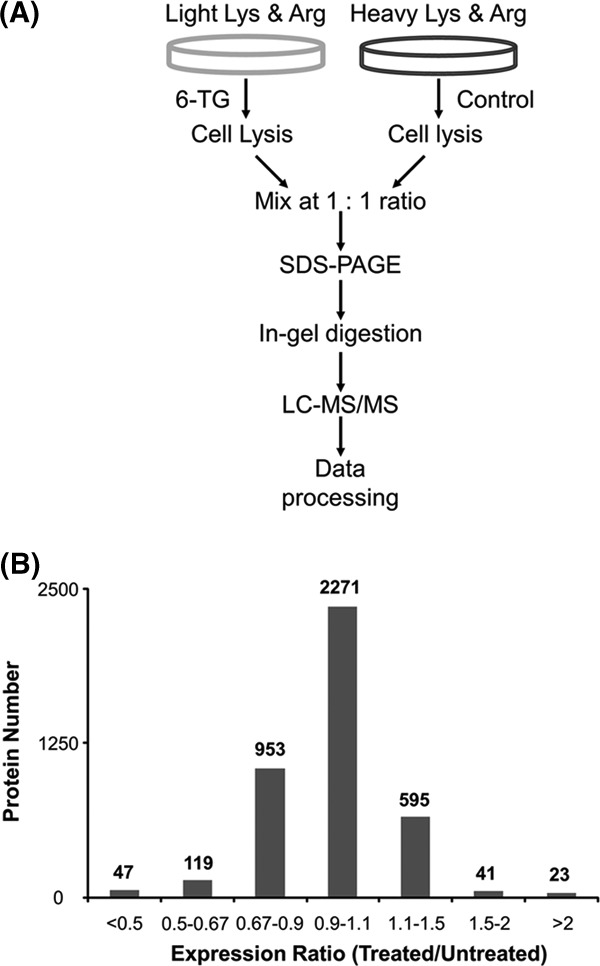
Fig. 1.

SILAC work flow and quantification results. A, a flowchart of forward SILAC combined with LC-MS/MS for the comparative analysis of protein expression in Jurkat T cells upon SG treatment. B, the distribution of expression ratios (treated/untreated) for the quantified proteins.
