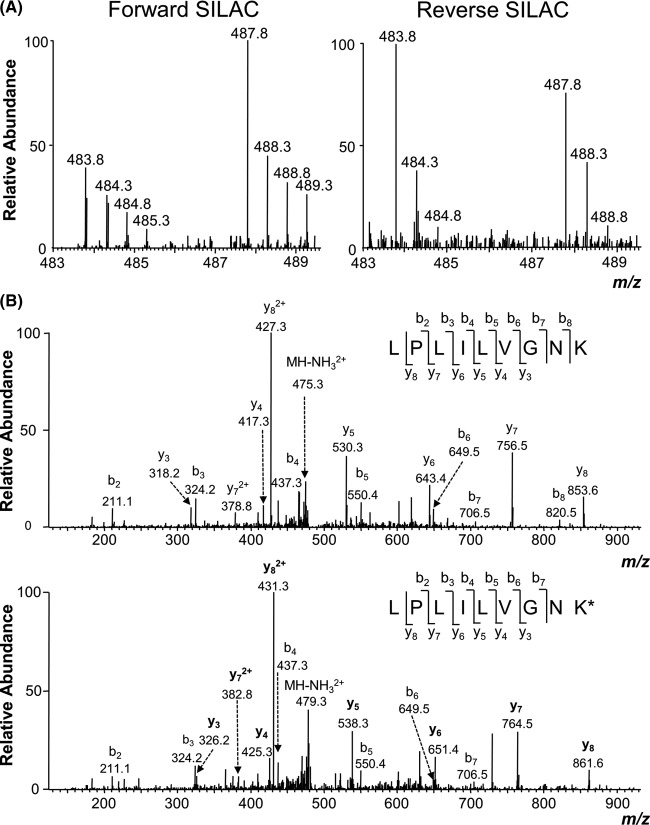
Fig. 2.
Example electrospray ionization MS data revealing the SG-induced down-regulation of Miro1. Shown are the MS results for the [M+2H]2+ ions of Miro1 peptides LPLILVGNK and LPLILVGNK* (K* denotes the heavy-labeled lysine) from the forward (left) and reverse (right) SILAC labeling experiments (A) and MS/MS results for the [M+2H]2+ ions of LPLILVGNK and LPLILVGNK* (B); heavy-labeled lysine-containing y-ions are labeled in bold.

