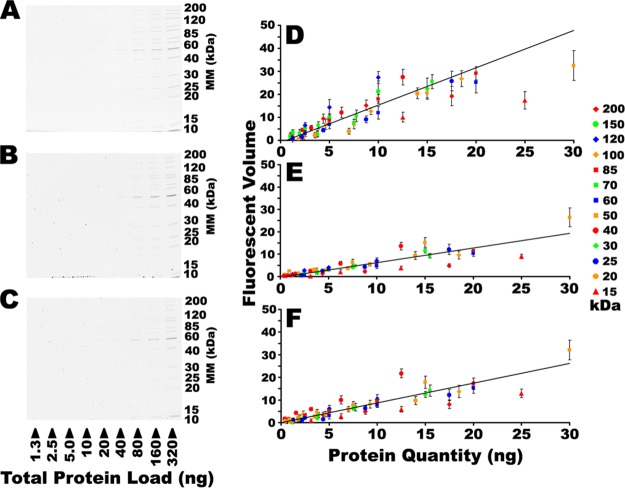
Fig. 2.
Assessing sensitivity of SR and CB. A dilution series of a commercially available mixture of 13 recombinant protein standards was resolved by 1DE and detected with either SR (A) or stained with one of 14 different CB formulations and detected using IRF. Only CB formulations ii (B) and xii (C) are shown here; all other formulations are shown in supplemental Fig. S2. The fluorescent volume in each band detected in images A–C are plotted in the corresponding right hand panels D–F, respectively. Trend lines indicate overall linear fits of the entire dataset. Error bars represent S.D., n = 3. Refer to supplemental Fig. S2 in Supplementary Data for the complete series of gel images.

