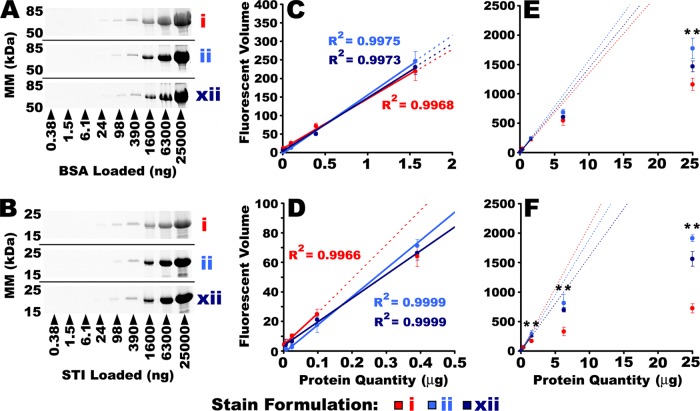
Fig. 5.
Assessing the linear dynamic range of SR and CB. A dilution series of isolated protein standards was resolved by 1DE and stained with either SR, or one of the two most sensitive CB formulations, ii and xii, and imaged with IRF. Pictured here in the left hand panels, are images of parallel BSA (A) and STI (B) dilution series. Quantitative image analysis was used to determine the LLD and the LDR for each stain/protein. Data near threshold are expanded in the center panels (C and D), and the full range of data are plotted in the right hand panels (E and F). The LDR was determined by regression analysis. Solid lines indicate the LDR for each stain and standard. Dotted lines indicate projection of the linear fit beyond the LDR. Gel images and quantitative LLD/LDR determinations for CEA, BCA, and CEL are shown in supplemental Fig. S3. ** Indicate CB IRF volumes that were significantly greater than SR. (One-way ANOVA. p < 0.001, Post-hoc Tukey analysis, p < 0.05, n = 3). Error bars indicate S.D. Refer to supplemental Fig. S3 in Supplementary Data for the complete series of gel images.

