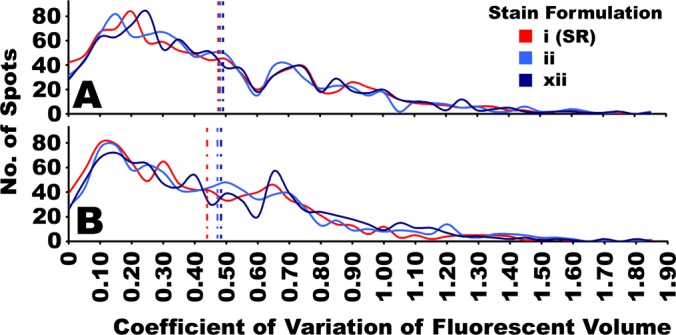
Fig. 8.

Inter-replicate variability of fluorescently imaged 2D gel proteomes stained with SR or CB. Mouse brain protein fractions; A, soluble fraction; B, membrane fraction, were resolved in a series of 2D gels (Fig. 7) and stained with either SR (stain i), or one of two CB formulations (stains ii and xii). Quantitative image analysis eliminated spots that were not detected in all four replicate gels in each condition, and only spots that were reproducibly detected and positionally matched in all replicates were considered (n = 4). The inter-replicate variability was then assessed as the coefficient of variation (ratio of standard deviation/mean) of the fluorescent volume for each spot. A distribution of the coefficients of variation for all of the reproducible spots detected by each stain tested were overlaid for comparison between stains, indicated with solid lines. Vertical dotted lines indicate the mean value in each distribution. (n = 4).
