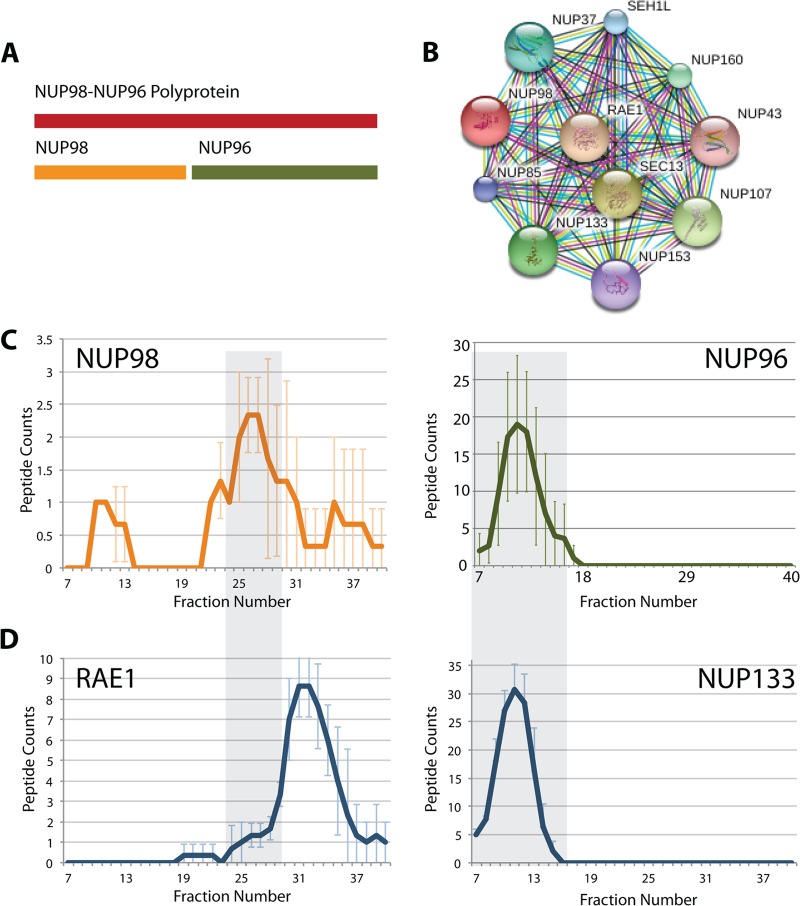
Fig. 11.
Analysis of protein isoforms formed by proteolytic cleavage. A, schematic showing that the NUP98-NUP96 polyprotein is cleaved to form the separate proteins NUP98 and NUP96. B, NUP98 interacting proteins as proposed by the STRING database. C, average SEC elution profiles for peptides associated with specific regions corresponding to the NUP98 protein (orange profile) and the NUP96 protein (green profile). The line graphs represent the peptide count (y-axis) detected for each SEC fraction (x-axis). D, SEC elution profiles for RAE1 and NUP133 (x- and y-axes labeled as for part C). The gray boxes highlight fractions where we propose RAE1 and NUP98 interact and where NUP133 and NUP96 interact. Error bars indicate standard deviation from the mean.

