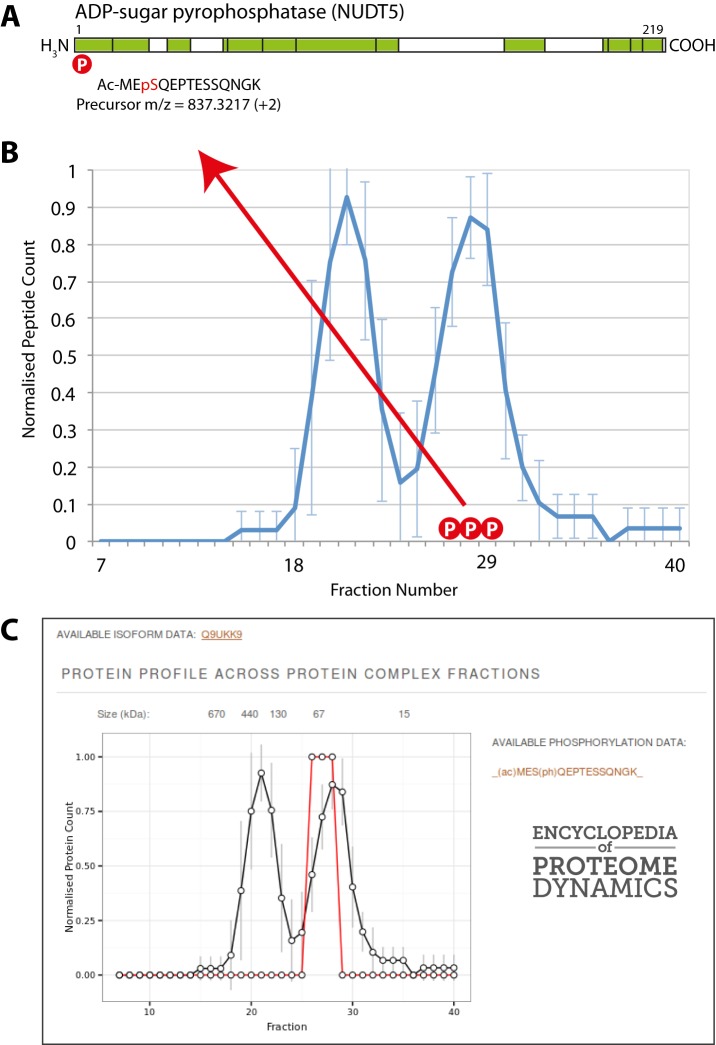
Fig. 12.
Comparison of unmodified and phosphorylated protein profiles. A, graphical representation of the peptides identified for the NUDT5 protein (shown in green). The letter “P” in the red circle denotes a phosphorylation site on the NUDT5 protein. B, the line graph illustrates the SEC elution profile for the NUDT5 unmodified protein. Error bars represent the standard deviation from the mean. The letter “P” in a red circle denotes a fraction containing the phosphorylated peptide (Ac-MEpSQEPTESSQNGK). C, a screen shot of these data presented in the Encyclopedia of Proteome Dynamics. Elution profiles show the normalized peptide count on the y-axis plotted against the SEC fraction on the x-axis.

