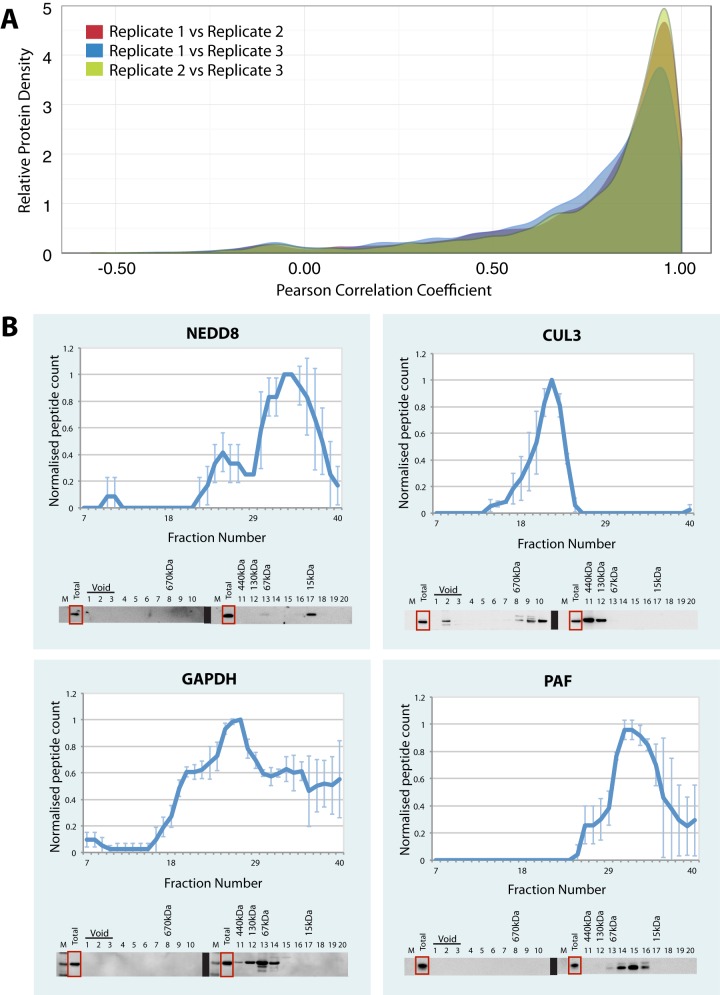
Fig. 3.
Reproducibility of the SEC elution profiles. A, the Pearson correlation coefficient was calculated for the three biological replicates (replicate 1 versus replicate 2, replicate 1 versus replicate 3, and replicate 2 versus replicate 3). The relative protein density (y-axis) was plotted against the Pearson correlation coefficient for each replicate (x-axis). B, the SEC elution profiles for selected proteins are displayed as line graphs with the normalized peptide count (y-axis) plotted against each elution fraction (x-axis). Error bars indicate the standard deviation from the mean across three biological replicates. Below each line graph are immunoblots for each protein of interest. A total of 10 μg of protein was loaded in the “total” lane and up to a maximum of 10 μg of protein was loaded per lane for each of the fractions. The annotated molecular weights were estimated from the elution profiles of the protein standards injected onto the SEC column.

