
Fig. 8.
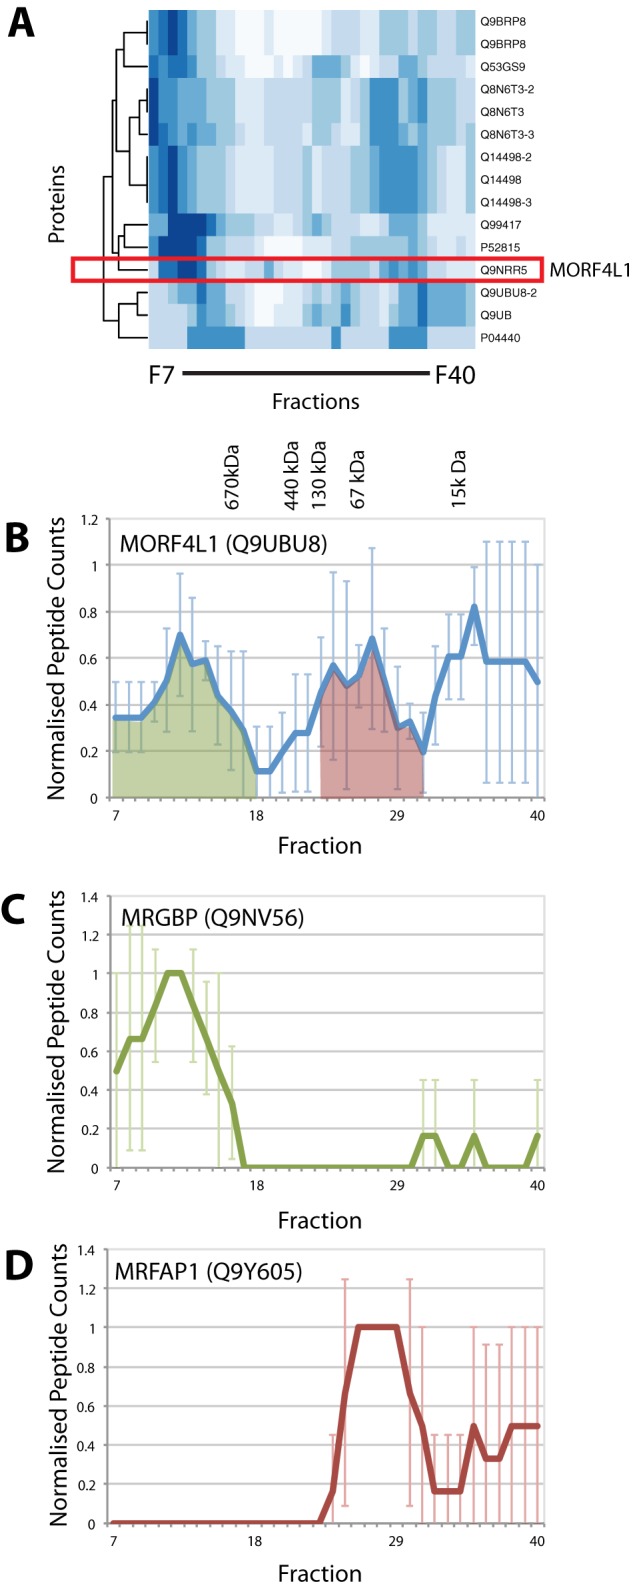
Analysis of proteins participating in multiple complexes. A, heat map for one cluster containing proteins with multiple elution peaks across 34 SEC fractions. The MORF4L1 protein is highlighted in the red box. The SEC elution profiles for MORF4L1 (B), MRGBP (C), and MRFAP1 (D) are shown as line graphs with normalized peptide counts (y-axis) plotted for each SEC fraction (x-axis). Peaks where MORF4L1 and MRGBP profiles overlap are shaded in green, and those where MORF4L1 and MRFAP1 overlap are in red. Error bars indicate the standard deviation from the mean.