
Fig. 2.
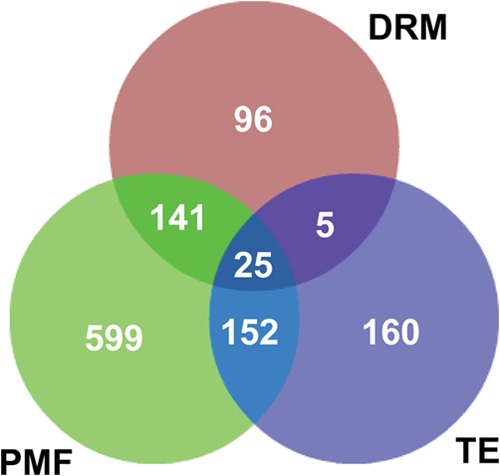
Qualitative proteomic analysis of plasma membrane fraction (PMF), detergent-resistant microdomains (DRM), and Triton extract (TE). The Venn diagram represents the number of proteins identified from SDS-PAGE of PMF, DRM, and TE. In total, 917, 267, and 342 proteins were identified through MS analysis of PMF, DRM, and TE, respectively.